

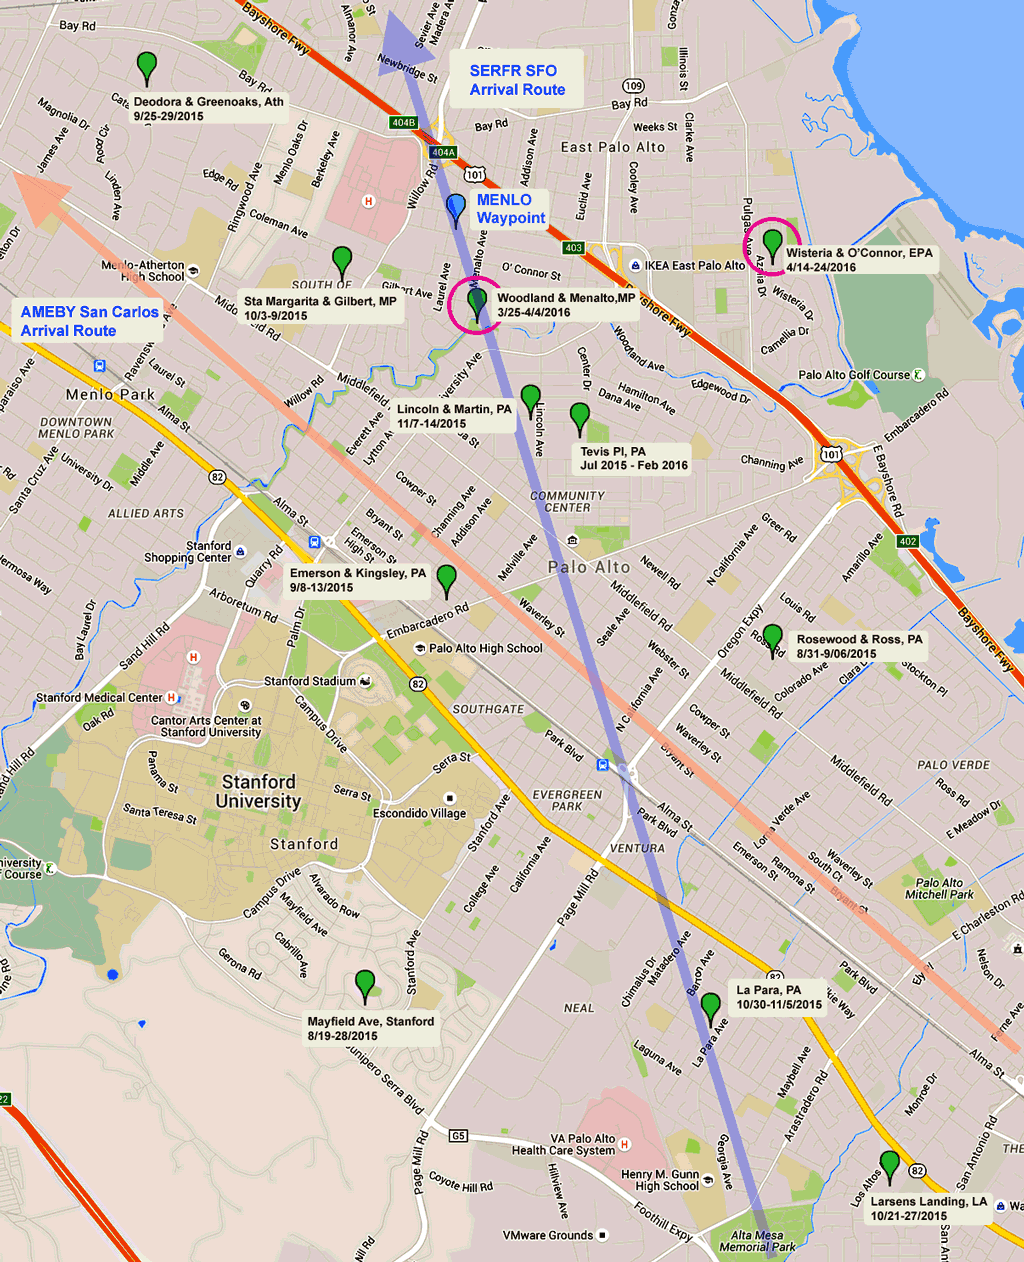
This interim report updates a series of studies I have been doing related to FAA NextGen aircraft overflight noise around Palo Alto over the past 9 months. The particulars of this update are that I have recorded and analyzed an 11-day series of observations at Woodland & Menalto in Menlo Park; and an 11-day series of observations at Wisteria & O’Connor in East Palo Alto. These locations are circled in red on the geo map (Figure 1) and the results are included in the subsequent graphical materials summarizing various characteristics of the overflight noises. I have also included in the Figure 1 map a marker for the MENLO waypoint used by aircraft as a guide for the SERFR approach route and from which they turn to approach SFO.
A couple of things make these additions interesting:
- Woodland & Menalto, MP lies directly under the SERFR route just downstream from the Pope-Chaucer bridge over San Francisquito Creek, about midway between MENLO and the previously reported site at Lincoln & Martin, PA.
- The median noise amplitude estimate at Woodland & Menalto (60.5 dBA) is 0.9 dBA higher than at Lincoln & Martin (59.6 dBA), which might be expected based on decreasing altitude. The median SEL size (integrated noise energy in each overflight peak) is 1.2 dBA higher at Woodland & Menalto (73.4 dBA) than at Lincoln & Martin (72.2 dBA).
- The average raw data DNL value at Woodland & Menalto (58.5 dBA) is similarly higher (1 dBA) than that at Lincoln & Martin (57.5 dBA). However, the DNL value, after removing ALL detected aircraft noise, falls by only 1.5 dBA at Woodland & Menalto (to 57.0 dBA), while it falls 4.4 dBA at Lincoln & Martin (to 53.1 dBA). This is likely the result of a higher background noise at the Woodland site (creek background noises?). Still, subjectively, both sites report very strong annoyance at the overflight events and frequencies.
- The average number of peaks detected at Woodland & Menalto (238 per day) is lower by 26% than the number of peaks at Lincoln & Martin (321 per day), and almost all of them (99.6%) are above 50 dBA. It is not clear why there are fewer detected overflights at Woodland & Menalto. This could be because the higher background makes it harder to detect lower amplitude peaks, or other types of aviation avoid the MENLO waypoint because of the SFO approach traffic at a relatively low altitude. The data were also collected at different times (mid November 2015 vs late March 2016), but there does not appear to be any other indicators of reduced overflight volume over this time period.
- The Wisteria & O’Connor site is the first measurement taken in East Palo Alto. The site lies between the SERFR and MODESTO approach routes for SFO, and is also affected by operations at the Palo Alto Airport. This site has a noise exposure that is comparable to sites in Palo Alto, Menlo Park, and Atherton near the MENLO waypoint and routes into SFO and San Carlos
Your comments, suggestions, and corrections are welcome as always…
5/5/2016
Background
Since the FAA started rolling out their NextGen new flight management program in the San Francisco bay area in late 2014, mid-peninsula communities (Palo Alto and surrounding communities) have experienced a significant increase in aircraft overflight events with noise levels that are considered to be highly intrusive and unacceptable, especially when compared to pre-2014 levels when aircraft overflight noise was never a problem. A poll of north Palo Alto residents in mid-2015 showed that over 70% found the newly introduced aircraft noise very disturbing (see this link).
The FAA uses an average daily sound measure (DNL) to decide whether or not aircraft noise levels are acceptable or not — below 65 dBA the sound level is “acceptable” and above 65 dBA it is not. A quote extracted from a Summary Report of the FAA Workshop on Aircraft Noise Impacts Research [San Diego, CA; March 4, 2010; see this link] illustrates this point:
The technical bases for FAA’s noise policies were last reviewed in 1992. [FICON: “Federal Agency Review of Selected Airport Noise Analysis Issues,” August 1992.] Currently, this policy identifies a value of 65 dB Day-Night Average Sound Level (DNL) as the threshold of significant impact for purposes of the National Environmental Policy Act (NEPA) analyses of FAA major actions. This threshold corresponds to about 13% of the population which will report high annoyance (the “Schultz” curve)…
Attendees at this workshop pointed out that DNL is a simplistic measure and that other factors, like very high local sound levels and frequency of operations, play an equally important role in determining whether or not aircraft operations noise is intrusive and disturbing. A recent study, Aircraft noise and public health: the evidence is loud and clear [Commissioned by the Heathrow Association for the Control of Aircraft Noise and the Aviation Environment Trust in the UK, January 2016; see this link], presents strong evidence that many aspects of stress-related physical health, mental health, and childhood development and learning are affected by aircraft noise for levels above about 50 dBA.
As will be seen in the plots below, measured DNL levels around Palo Alto fall in the range of 52 – 58 dBA and hence are considered acceptable by current FAA standards, but not by growing standards of modern research. Despite these DNL values, many overflight events have maximum sound levels of 65 to over 70 dBA, and during busy aircraft arrival/departure times morning through evening, there are long sequences of overflights at these high sound levels that interrupt conversation, concentration, entertainment, and sleep that are particularly disturbing. According to recent data collected, typically 3 – 6 events per week that occur during nighttime hours — midnight to 5:00 AM — have sound intensities above 70 dBA, and 10 – 15 nighttime events per week are louder than 65 dBA.
The bottom-line point of these data is that the FAA DNL measure by itself is inadequate for measuring the true impact of aircraft noise and that there are clearly evident annoyance and stress-related disturbance effects in our community following introduction of the NextGen changes in the mid-peninsula region.
A more recent guideline under development by the FAA (FAA Order 1050.1F, Environmental Impacts: Policies and Procedures, July 2015) revised the FAA noise impact policy to include the following new criteria for significant impact:
- DNL 65 dB and higher, a noise increase of +1.5 dB
- DNL 60 dB to <65 dB, a noise increase of +3 dB
- DNL 45 dB to <60 dB, a noise increase of +5 dB
The site measurements in this study (see Figure 6) indicate that the DNL values, between 52 – 58 dBA, fall into the third category. The DNL values re-computed with ALL detected aircraft noise peaks removed are co-plotted in Figure 6 and it can be seen that the noise increases exceed +5 dB often, but not always in these measurements. We believe that these noise increases qualify this region for corrective measures to reduce the impact of overflights. It should also be noted that ALL the noise peaks that were removed in this study, include traffic not only to/from SFO, but also traffic for other regional airports that overfly the space around Palo Alto. This is why we believe the sought remedy must by a regional solution, not just an SFO solution.
Data Collection and Analysis Details
I have collected about a week’s worth of data from 11 sites as follows:
- Tevis Place, PA; 6 collections, July 12-15, Aug 3-11, Sept 15-22, Nov 19-24, Jan 25-28 (2016), and Feb 6-16 (2016)
- Mayfield Ave, Stanford; 8/19-28/2015
- Rosewood & Ross, PA; 8/31-9/06/2015
- Emerson & Kingsley, PA; 9/8-13/2015
- Deodora & Greenoaks, Atherton; 9/25-29/2015
- Sta Margarita & Gilbert, MP; 10/3-9/2015
- Larsens Landing, Los Altos; 10/21-27/2015
- La Para, PA; 10/30-11/5/2015
- Lincoln & Martin, PA; 11/7-14/2015
- Woodland & Menalto, MP; 3/25-4/4/2016
- Wisteria & O’Connor, EPA; 4/14-24/2016
The geographic distribution of these sites is shown on the map in Figure 1.
From each site, I collected 24-hour noise measurements over the date ranges indicated above with a Reed SD-4023 sound meter. The meter was set to the A-weighted sensitivity profile, automatic range selection, slow response, and 2-second sample intervals. The calibration of the instrument was checked before and after collection at each data site with a Reed SC-05 Sound Level Calibrator and was found to be quite stable to within ±1.5 dBA. Each 24-hour noise record was then analyzed with a program written by the author. The details of the program cannot be described here (but will be in a separate write-up — a preliminary description can be found at this link), but the analysis steps are summarized as follows:
- Estimate the local signal background with a multi-pass, symmetric, exponential filter procedure.
- Estimate the local variation (standard deviation) of non-aircraft-peak-like parts of the signal with an adaptive procedure to set a variable local detection threshold
- Identify and isolate peaks consistent with aircraft overflight events; using amplitude, peak width, peak shape, and peak noisiness criteria. Isolated peaks are further processed to identify and isolate unresolved multiplets from near simultaneous overflights. Again, amplitude, width, shape, and noisiness criteria are used to select true subpeaks.
- The resulting list of time-stamped overflight peaks during each observation period is then analyzed statistically to derive parameters such as the DNL/CNEL levels with and without aircraft overflights; histograms of net noise amplitudes, integrated peak energy (SEL) values, peak widths, temporal spacing (local frequencies) of overflights; as well as estimates of diurnal variation of these parameters. In these analyses, we catalog statistical data separately for all aircraft noise events, no matter what amplitude, as well as for only those above 50 dBA.
I will eventually provide an appendix to describe and illustrate each step of this process, but for now I present just overall high-level comparison of the sites. To provide a bit of a road map of what lies below, I offer the following list of sections and figures:
- Comparison of the average daily number of noise peaks recorded at the sites (Figure 2), including counts for all peaks and counts for peaks > 50 dBA in amplitude.
- Comparison of the medians and ranges of variation for noise peak amplitudes recorded at the sites (Figure 3).
- Comparison of the medians and ranges of variation for the sound energy in each noise peak (SEL, Sound Exposure Level) recorded at the sites (Figure 4).
- Comparison of the total sound energy from aircraft overflights received at the sites (Figure 5). (“Total sound energy per day” is defined to be the median SEL value times the average number of peaks per day.
- Comparison of the FAA-defined DNL (“Day/Night Average Sound Level”) values for each site (Figure 6), with and without aircraft noise present.
- Comparison of the median burst frequencies of overflights and ranges of variation at the sites (Figure 7). “Burst frequency” uses the average time interval within successive groups of five peaks to measure instances of highly repetitious overflight events. To make this clearer, suppose we have a set of detected peaks P1, P2, … Pn at times t1, t2, … tn. The first group of five peaks, P1 … P5 has an average inter-peak time interval of (t5 – t1)/4, the reciprocal of which gives the burst frequency at (P3, t3), the center of the group. Similarly, the burst frequency at (P4, t4) is calculated from the average time interval between peaks P2 … P6, and so on.
- Comparison of the medians and ranges of variation for noise peak durations recorded at the sites (Figure 8).
- Plots for each site of diurnal distributions of significant (> 50 dBA) noise events by loudness and by burst frequency (Figures 9a – 9v).
Data Summaries and Discussion
Note About Graphical Data: In the following overview plots, the data are plotted indexed by study site. The order of the study sites along the abscissa was determined left to right by increasing rank in the approximate average total sound energy exposure index per day (median SEL size during the test period multiplied by the average number of peaks per day for a given site). Figure 5 shows a comparison of the average total sound energy exposure index by site used to do this sort, along with a plot of the more rigorous statistics of the daily summed SELs for each site. The reason the index was used instead of the straightforward totals was it is a more stable measure of sound exposure in that it uses the median SEL per site and thereby avoids the effects of outliers in the data caused by one or two exceptionally large peaks.
1. Number of Overflights per Day
Figure 2 compares the average daily number of noise peaks recorded by site, showing counts for all peaks and for peaks > 50 dBA in amplitude.
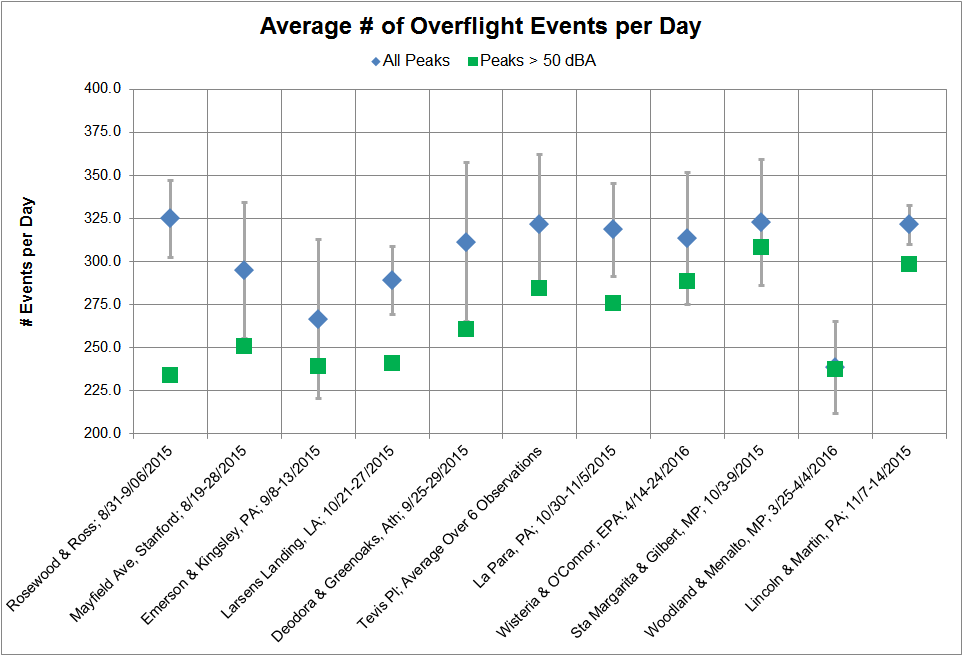
The error bars show one standard deviation (1σ) in the distribution of peaks counts for each site. There is some variation in the total numbers of peaks detected between the sites, but typically around 320 peaks per day are seen. Discounting nighttime hours (4 hours between 1:00 AM and 5:00 AM), over the remaining 20 hours this means there are on average about 16 overflights per hour, or one every 3-4 minutes.
As seen in the figure, typically 85-90% of the overflight peaks have amplitudes above 50 dBA; an average count per day of about 270, or about 13 per hour. These overflights are not uniformly distributed in time and so there are many intervals with bursts of overflights at significantly higher frequencies (see Figure 7).
The Woodland & Menalto site is an exception to this generalization in that the average number of peaks detected (238 per day) is lower by 26% than the number of peaks at Lincoln & Martin (321 per day), and almost all of them (99.6%) are above 50 dBA. As noted earlier, it is not clear why there are fewer detected overflights at Woodland & Menalto. This could be because the higher background makes it harder to detect lower amplitude peaks, or other types of aviation avoid the MENLO waypoint because of the SFO approach traffic at a relatively low altitude. The data were also collected at different times (mid November 2015 vs late March 2016), but there does not appear to be any other indicators of reduced overflight volume over this time period.
2. Peak Amplitudes and Variations
Figure 3 compares the medians and ranges of variation for noise peak amplitudes (sound level maxima) above background recorded at the sites. As can be seen, the median peak amplitudes correlate fairly well with the total sound energy exposure per day (Figure 5) since the medians generally increase from left to right and have a range between 55 and 60 dBA, well above the 50 dBA level identified in recent literature as causing health and annoyance issues. The distributions of peak amplitudes at each site are not symmetrical so standard deviation measures are computed separately for the amplitudes below and above the median.
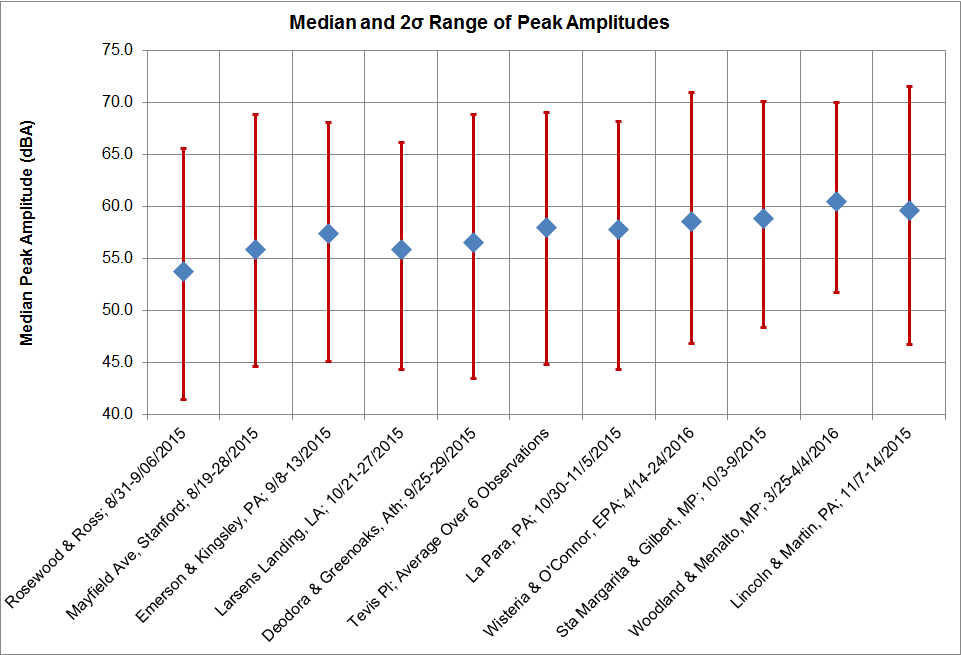
The variation bars shown in the figure are 2σ relative to the median in order to give a fair estimate of the high and low values — two standard deviations includes about 95% of the peak amplitudes seen. As is evident, at most of the sites the highest peak amplitudes range from about 69 dBA to over 70 dBA, especially for the sites closest to the MENLO waypoint location, and a substantial number of these loud peaks occur during busy flight hours (and not infrequently, nighttime hours).
3. Peak Sound Energies and Variations
Figure 4 compares the medians and ranges of variation for noise peak energy values (SELs) recorded at the sites. These data are derived from the peak amplitude data by integrating (or summing) the total energy exposure above the background across a noise peak. Again, the median SEL amplitudes correlate fairly well with the total sound energy exposure per day (Figure 5) since the medians generally increase from left to right and are range between 66 and 72 dBA. These data also are consistent with the peak amplitude data in Figure 3 and the peak width data in Figure 7. The distributions of peak SELs at each site are not symmetrical so again standard deviation measures are computed separately for the amplitudes below and above the median.
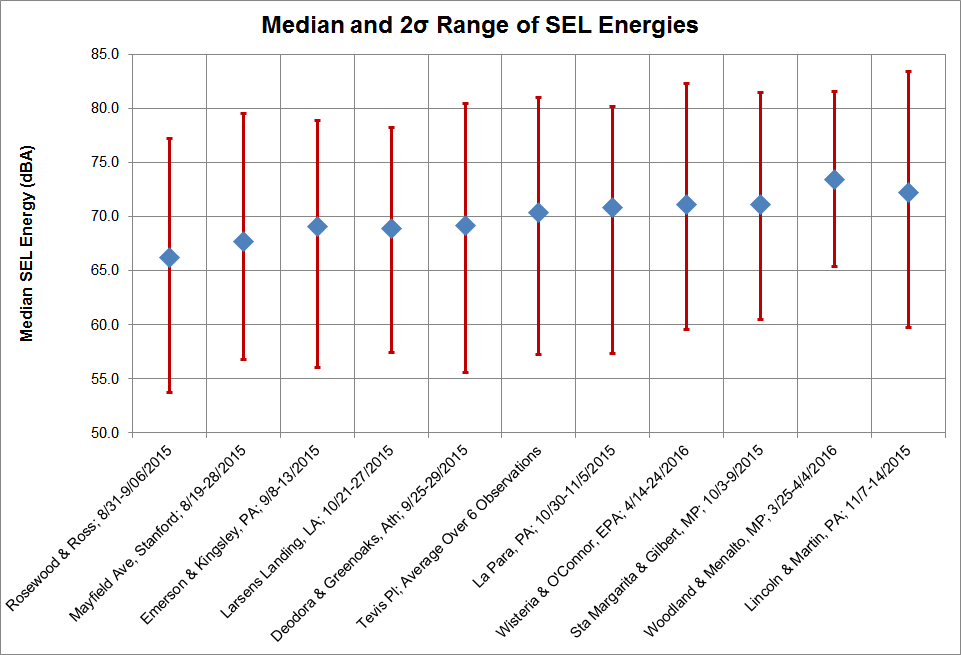
The variation bars shown are 2σ relative to the median in order to give a fair estimate of the high and low values — two standard deviations includes about 95% of the SEL amplitudes seen.
4. Total Sound Energy Exposure per Day
Figure 5 compares estimates of the total sound energy per day recorded at the sites using two approaches. The noise energy indices are derived from the SEL amplitude data (Figure 4) and the overflight count data (Figure 2) by multiplying the median SEL amplitude by the median overflight count per day for each site. In this plot sites are sorted by increasing sound exposure index from left to right and this order is used in all other plots. The actual sums of SEL values per day are used to compute data points shown in red with the average noise energy per day along with the standard deviation across the days measured. The total energy index estimates range between 91.5 and 97.5 dBA, a variation of about a factor of 4 from the lowest value to the highest. The average noise energy per day ranges from about 94.5 to 100.5 dBA. They are somewhat higher because occasional very large peaks in the data influence the average calculation but not that of the median.
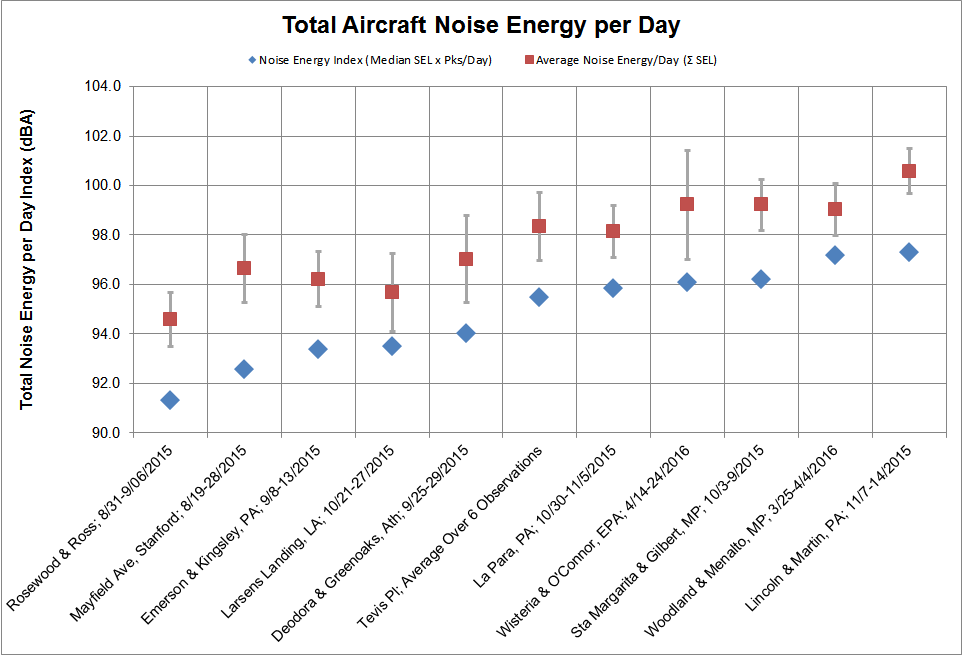
This plot shows more clearly that the sites closest to the MENLO waypoint (those to the right in the graph) receive a significantly higher daily dose of sound energy per day.
5. FAA-defined DNL Values for Each Site, With and Without Aircraft Noise Present
Figure 6 compares the conventional FAA DNL (Day/Night Average Sound Level) sound level measures recorded at the sites, with and without aircraft noise present. These data are the average and standard deviation of the individual DNL values computed for each day’s measurements at each site.
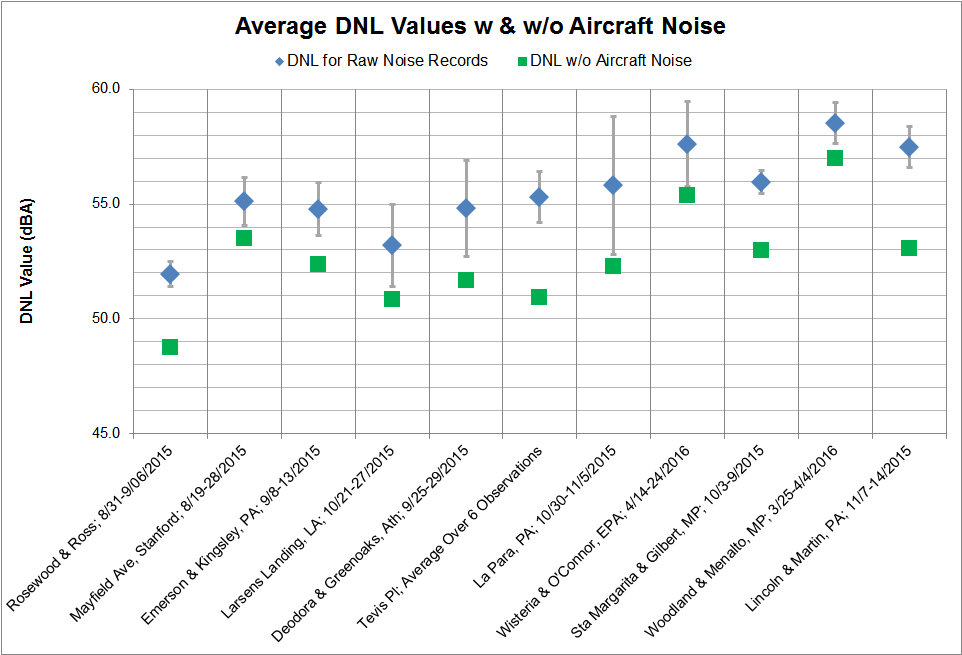
The general topology of this graph corresponds pretty well with that of the peak amplitude graph (Figure 3), but not very well with the total sound energy exposure plot (Figure 5). It also does not take into account the disturbance impacts of locally frequent repetitious overflight events. One can see that there is a significant difference between DNL values with and without aircraft noise peaks at many of the sites.
From the DNL values re-computed with ALL detected aircraft noise peaks removed, it can be seen that the average impact of overflights on the DNL values ranges from adding 2 – 4.5 dBA. Still, statistically the DNL increases exceed +5 dB often, but not always in these measurements. We believe that these noise increases are big enough to qualify this region for corrective measures to reduce the impact of overflights. As noted earlier, the noise peaks that were removed in this study include traffic not only to/from SFO, but also traffic for other regional airports that overfly the space around Palo Alto. This is why we believe any remedy must by a regional solution, not just an SFO solution.
6. Overflight Burst Frequencies and Variations
Figure 7 compares the median burst frequencies of overflights and ranges of variation at the sites. “Burst frequency” is defined as the reciprocal of the average time interval between successive groups of five noise peaks and is intended to measure instances of highly repetitious overflight events.
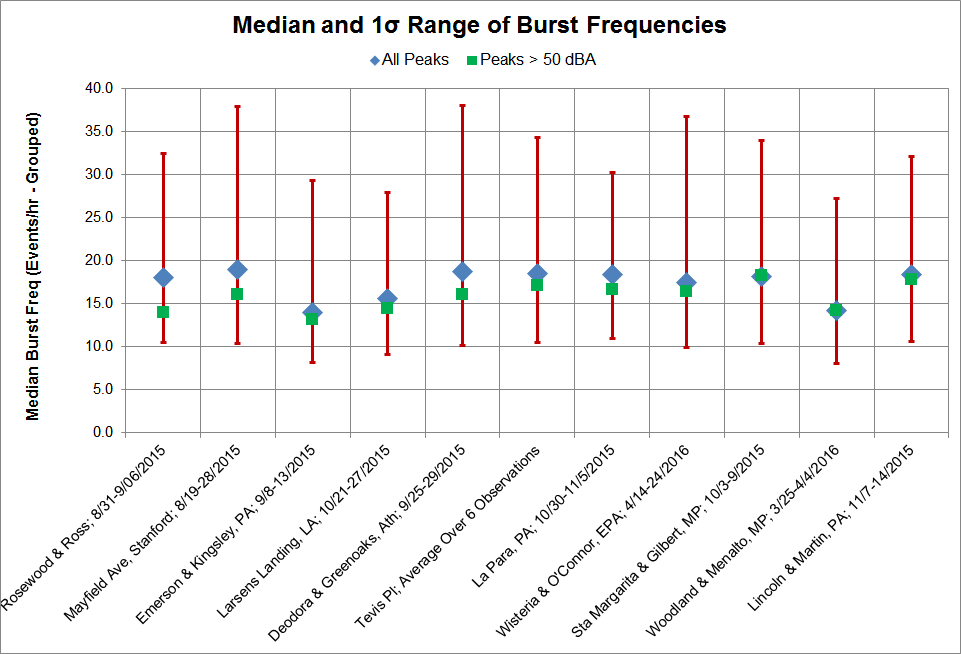
Except for two sites, the median overflight burst frequencies for all peaks (independent of size) cluster around 18.5 per hour — i.e., about 1 overflight every 3.2 minutes. The variation, however, is large reaching 30 – 35 overflights per hour (1σ) in busy times (i.e., about 1 overflight every 2 minutes) with many excursions to twice that rate. The burst frequencies of loud noise peaks (amplitudes > 50 dBA) are very similar to these numbers, meaning that during busy times loud overflights often follow each other with intervals of 1 to several minutes. This repetitive feature of overflight noises is particularly annoying (and potentially health threatening) during activities like conversations, concentration, learning, entertainment, sleeping, etc. This is especially true since as we will see in Figure 8, that the duration of each noise peak is typically on the order of 1 minute or more, meaning that successive noise peaks appear to overlap each other (or nearly so).
7. Overflight Noise Peak Durations and Variations
Figure 8 compares the medians and ranges of variation for noise peak durations recorded at the sites.
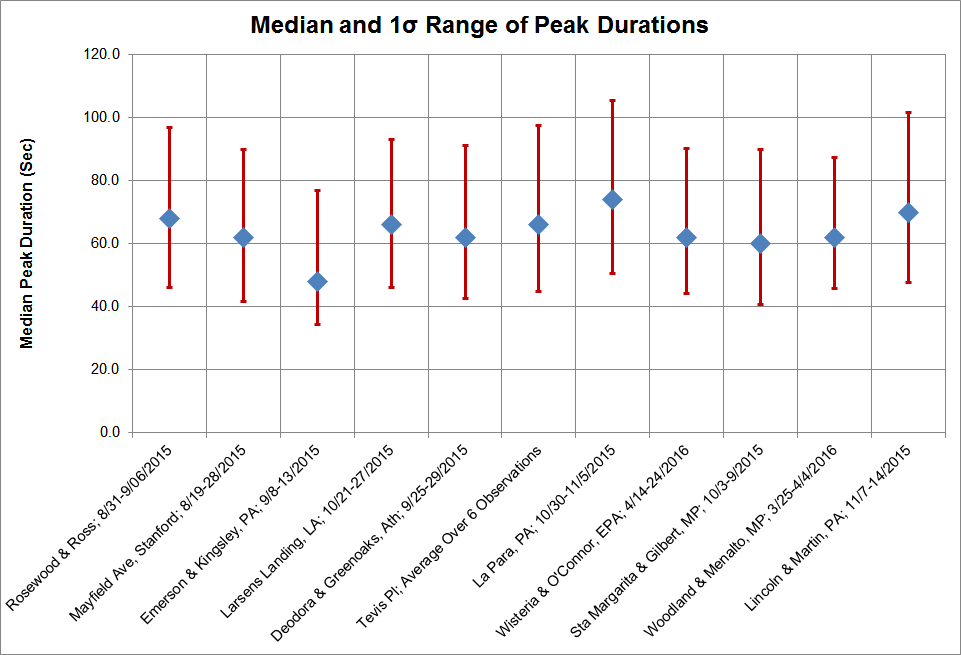
The median durations are pretty consistently around 61 seconds, but with many excursions to 90 seconds or more (1σ). As noted above, this increases the impact of repetitious overflights with time separations of one to a few minutes as this renders the sequence of aircraft disturbances as almost continuous and extremely annoying and hurtful.
8. Diurnal Distributions of Noise Events by Loudness and Burst Frequencies
Figures 9a – 9v show for each site the variations in the average number of noise peak events by time of day as measured by net peak amplitudes and by burst frequencies (for peaks with amplitudes > 50 dBA). These plots draw attention to the considerable differences in noise impact by time of day and by geography that depend on flight schedules and approach management criteria used by the FAA. Most of the peak traffic times fall within the prime parts of the day and evening so that they affect school, work, conversations, entertainment, and other daily routines.
-
Rosewood & Ross, PA; 8/31-9/06/2015
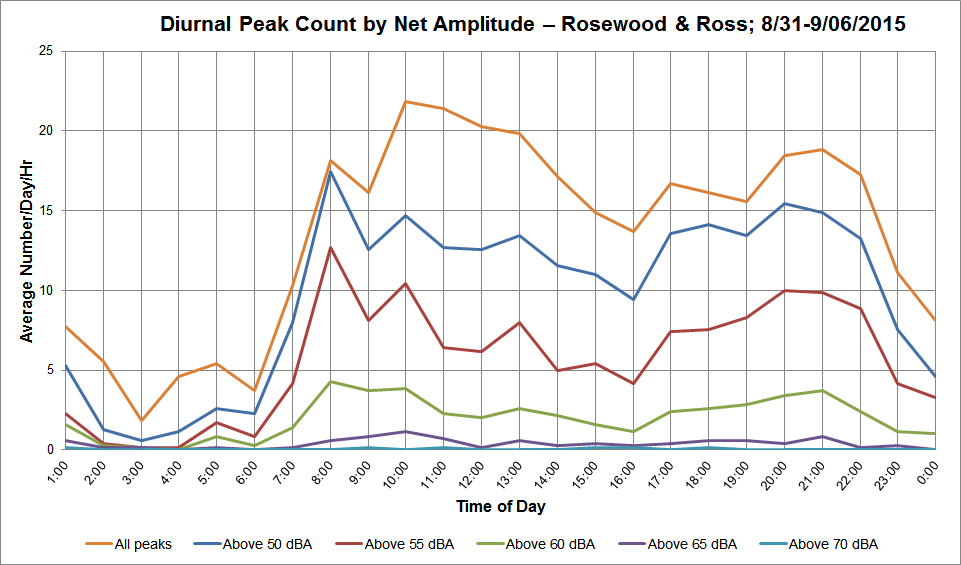
Figure 9a: Diurnal overflight events by peak amplitude (Rosewood & Ross, PA; 8/31-9/06/2015).
![[graph]](https://www.tcracs.org/tcrwp/wp-content/uploads/IR-160505-Figure-9b.png)
Figure 9b: Diurnal loud (> 50 dBA) overflights by burst frequencies (Rosewood & Ross, PA; 8/31-9/06/2015). -
Mayfield Ave, Stanford; 8/19-28/2015
![[graph]](https://www.tcracs.org/tcrwp/wp-content/uploads/IR-160505-Figure-9c.png)
Figure 9c: Diurnal overflight events by peak amplitude (Mayfield Ave, Stanford; 8/19-28/2015) ![[graph]](https://www.tcracs.org/tcrwp/wp-content/uploads/IR-160505-Figure-9d.png)
Figure 9d: Diurnal loud (> 50 dBA) overflights by burst frequencies (Mayfield Ave, Stanford; 8/19-28/2015) -
Emerson & Kingsley, PA; 9/8-13/2015
![[graph]](https://www.tcracs.org/tcrwp/wp-content/uploads/IR-160505-Figure-9e.png)
Figure 9e: Diurnal overflight events by peak amplitude (Emerson & Kingsley, PA; 9/8-13/2015)
![[graph]](https://www.tcracs.org/tcrwp/wp-content/uploads/IR-160505-Figure-9f.png)
Figure 9f: Diurnal loud (> 50 dBA) overflights by burst frequencies (Emerson & Kingsley, PA; 9/8-13/2015) -
Larsens Landing, LA; 10/21-27/2015
![[graph]](https://www.tcracs.org/tcrwp/wp-content/uploads/IR-160505-Figure-9g.png)
Figure 9g: Diurnal overflight events by peak amplitude (Larsens Landing, LA; 10/21-27/2015)
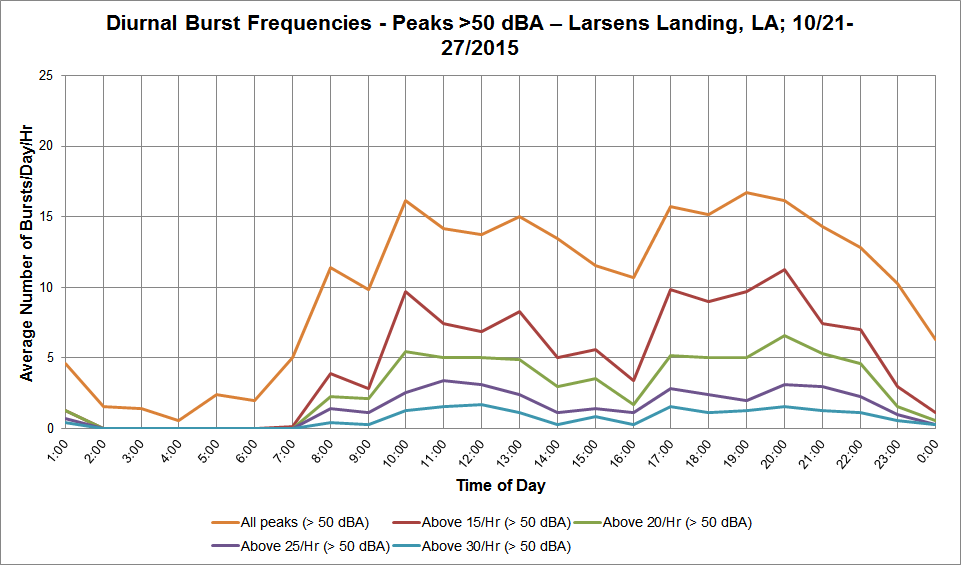
Figure 9h: Diurnal loud (> 50 dBA) overflights by burst frequencies (Larsens Landing, LA; 10/21-27/2015) -
Deodora & Greenoaks, Ath; 9/25-29/2015
![[graph]](https://www.tcracs.org/tcrwp/wp-content/uploads/IR-160505-Figure-9i.png)
Figure 9i: Diurnal overflight events by peak amplitude (Deodora & Greenoaks, Ath; 9/25-29/2015)
![[graph]](https://www.tcracs.org/tcrwp/wp-content/uploads/IR-160505-Figure-9j.png)
Figure 9j: Diurnal loud (> 50 dBA) overflights by burst frequencies (Deodora & Greenoaks, Ath; 9/25-29/2015) -
Tevis Pl, PA; Average Over 6 Observations
![[graph]](https://www.tcracs.org/tcrwp/wp-content/uploads/IR-160505-Figure-9k.png)
Figure 9k: Diurnal overflight events by peak amplitude (Tevis Pl, PA; Average Over 6 Observations)
![[graph]](https://www.tcracs.org/tcrwp/wp-content/uploads/IR-160505-Figure-9l.png)
Figure 9l: Diurnal loud (> 50 dBA) overflights by burst frequencies (Tevis Pl, PA; Average Over 6 Observations) -
La Para, PA; 10/30-11/5/2015
![[graph]](https://www.tcracs.org/tcrwp/wp-content/uploads/IR-160505-Figure-9m.png)
Figure 9m: Diurnal overflight events by peak amplitude (La Para, PA; 10/30-11/5/2015)
![[graph]](https://www.tcracs.org/tcrwp/wp-content/uploads/IR-160505-Figure-9n.png)
Figure 9n: Diurnal loud (> 50 dBA) overflights by burst frequencies (La Para, PA; 10/30-11/5/2015) -
Wisteria & O’Connor, EPA; 4/14-24/2016
![[Graph]](https://www.tcracs.org/tcrwp/wp-content/uploads/IR-160505-Figure-9o.png)
Figure 9o: Diurnal overflight events by peak amplitude (Wisteria & O’Connor, EPA; 4/14-24/2016)
![[graph]](https://www.tcracs.org/tcrwp/wp-content/uploads/IR-160505-Figure-9p.png)
Figure 9p: Diurnal loud (> 50 dBA) overflights by burst frequencies (Wisteria & O’Connor, EPA; 4/14-24/2016). -
Sta Margarita & Gilbert, MP; 10/3-9/2015
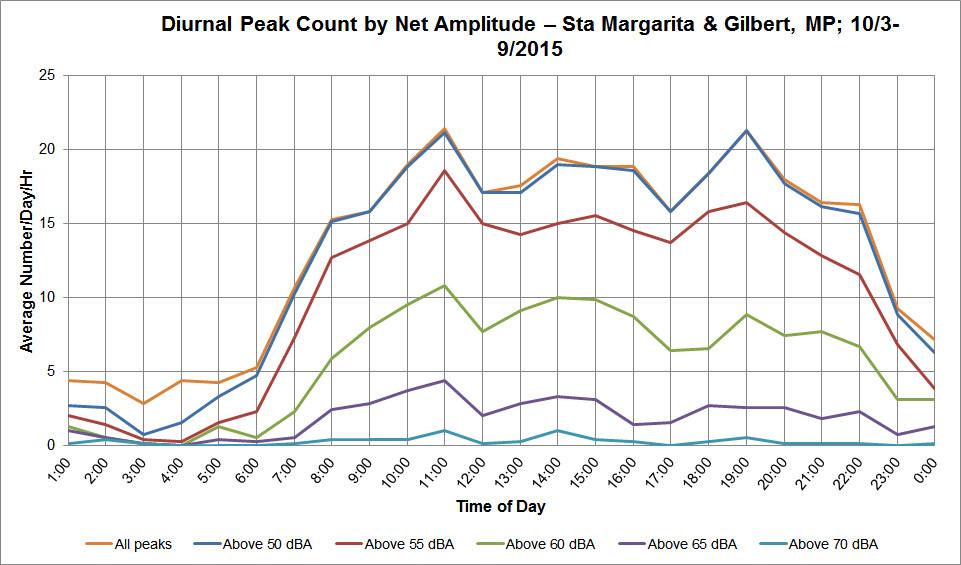
Figure 9q: Diurnal overflight events by peak amplitude (Sta Margarita & Gilbert, MP; 10/3-9/2015)
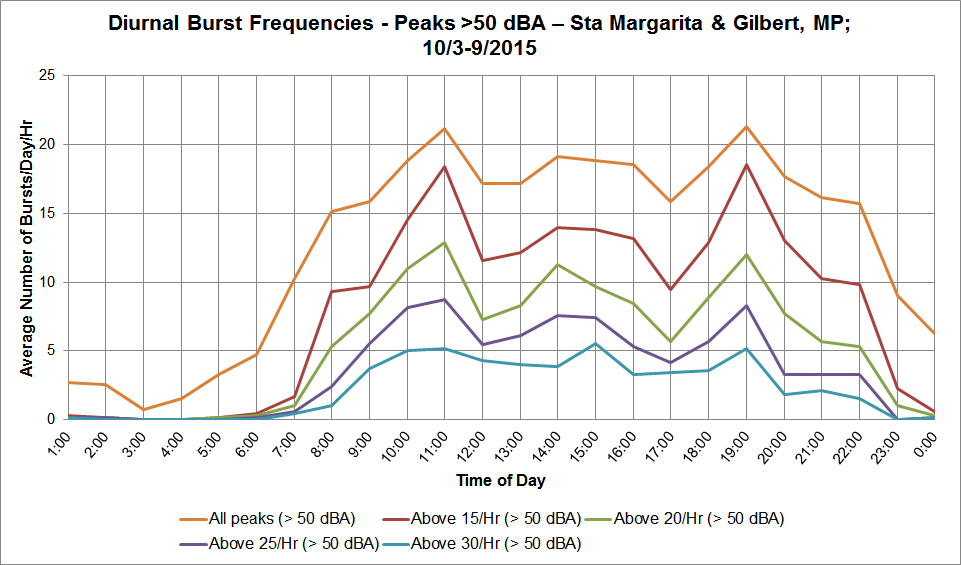
Figure 9r: Diurnal loud (> 50 dBA) overflights by burst frequencies (Sta Margarita & Gilbert, MP; 10/3-9/2015) -
Woodland & Menalto, MP; 3/25-4/4/2016
![[graph]](https://www.tcracs.org/tcrwp/wp-content/uploads/IR-160505-Figure-9s.png)
Figure 9s: Diurnal overflight events by peak amplitude (Woodland & Menalto, MP; 3/25-4/4/2016)
![[graph]](https://www.tcracs.org/tcrwp/wp-content/uploads/IR-160505-Figure-9t.png)
Figure 9t: Diurnal loud (> 50 dBA) overflights by burst frequencies (Woodland & Menalto, MP; 3/25-4/4/2016) -
Lincoln & Martin, PA; 11/7-14/2015
![[graph]](https://www.tcracs.org/tcrwp/wp-content/uploads/IR-160505-Figure-9u.png)
Figure 9u: Diurnal overflight events by peak amplitude (Lincoln & Martin, PA; 11/7-14/2015)
![[graph]](https://www.tcracs.org/tcrwp/wp-content/uploads/IR-160505-Figure-9v.png)
Figure 9v: Diurnal loud (> 50 dBA) overflights by burst frequencies (Lincoln & Martin, PA; 11/7-14/2015)