This document compares in various ways the physical aircraft noise data I have been collecting in the Palo Alto (PA) area with the data collected by BridgeNet International for SFO in the Santa Cruz (SC) area. The description gives a graphical side-by-side comparisons of PA and SC data with analyses that tease out answers to questions like (a) how many overflights occur per day; (b) how loud are they; (c) when do they occur; (d) how much do they bunch together; (e) how long do the noise events last; and (f) how do these measures compare with the “standard” FAA DNL measures.
I have written a preliminary summary (see this link [PDF]) of the analysis steps my programs go through to extract from the raw noise monitor data parameters such as the DNL/CNEL levels with and without aircraft overflights; histograms of net noise amplitudes, integrated peak energy (SEL) values, peak widths, temporal spacing (local burst frequencies) of overflights; as well as estimates of diurnal variation of these parameters. In these analyses, I have cataloged statistical data separately for ALL aircraft noise events, no matter what amplitude, as well as for the more limited set of peaks with amplitudes above 50 dBA. I have applied these steps uniformly to the PA and SC data sets in producing the graphs below.
Tom Rindfleisch
March 2016
Background of My Analyses and Results
Source of Data
As of the date of this report, I have collected raw noise monitor data from 9 locations in and near Palo Alto, and BridgeNet collected noise data from 5 locations in the Santa Cruz area. All of the sites lie along the new NextGen SERFR route put in place by the FAA for approaches to SFO starting in late 2014. There is clearly more overflight traffic than that which is SFO bound, e.g., traffic bound for other regional airports such as San Jose, Oakland, and San Carlos; and local general aviation traffic. My programs have tried to detect noise peaks for all this traffic, independent of source and destination. Still the very large (and noisy) commercial aircraft with busy arrival and departure schedules generate a lion’s share of the noise.
The sites from which data were collected are listed in Table 1 and are flagged on the Google map in Figure 1 with the SERFR route superimposed.
| Palo Alto Area (TCR Data) | Santa Cruz Area (BridgeNet Data) |
|---|---|
| Rosewood & Ross (PA) 8/31-9/06/2015 |
Amigo Rd (Soquel) 6/27-7/12/2015 |
| Mayfield Ave (Stanford) 8/19-28/2015 |
Fast Ln (Santa Cruz) 6/27-7/12/2015 |
| Emerson & Kingsley (PA) 9/8-13/2015 |
Vine Hill Rd (Santa Cruz) 6/28-7/12/2015 |
| Larsens Landing (Los Altos) 10/21-27/2015 |
Woodlander Pl (Santa Cruz) 6/27-7/12/2015 |
| Deodora & Greenoaks (Atherton) 9/25-29/2015 |
Wilderfield Rd (Los Gatos) 6/27-7/9/2015 |
| Tevis Pl (PA) Average of 6 Observations |
|
| La Para (PA) 10/30-11/5/2015 |
|
| Santa Margarita & Gilbert (MP) 10/3-9/2015 |
|
| Lincoln & Martin (PA) 11/7-14/2015 |
Notes about the Data
The BridgeNet data are rather varied in format in that they were taken simultaneously at the 5 locations (June 26 – July 9 or 12), but using 3 different types of monitoring instruments — 1 type at 2 locations, another type at 1 location, and a third type at the remaining 2 locations. Also at several of the monitoring sites some kind of alarm (siren, church bell, city clock, …) goes off at 6:00, 12:00, 18:00, and 24:00, that lasts for about 45 seconds and has a high noise level at or above 90 dBA. The BridgeNet analysis data do not include those events as they totally dominate any DNL/CNEL calculation, but their report does not describe how these extra contributions to the background were removed. For my analyses, I also took these peaks out manually by filling in these regions with the local (constant) background.
One additional difference between the BridgeNet report and my calculations is that the BridgeNet data were collected at 1 second intervals and presumably processed with that temporal spacing. My programs are set to process data collected at 2 second intervals, so I reduced the resolution of the BridgeNet data by half by averaging (in linear energy space) successive BridgeNet data points, reconverting to dBA, and taking every other point for my analyses. Theoretically, this will not affect DNL and CNEL calculations and still satisfies the Nyquist sampling requirement to capture details of the overflight noise peaks.
To provide a bit of a road map of what follows below, I offer the following list of sections and figures:
- Comparison of the average daily number of noise peaks recorded at the sites (Figure 2), including counts for all peaks and counts for peaks > 50 dBA in amplitude.
- Comparison of the medians and ranges of variation for noise peak amplitudes recorded at the sites (Figure 3).
- Comparison of the medians and ranges of variation for the sound energy in each noise peak (SEL, Sound Exposure Level) recorded at the sites (Figure 4).
- Comparison of the total daily sound energy from aircraft overflights received at the sites (Figure 5). (“Total sound energy per day” is defined to be the median SEL value times the average number of peaks per day.
- Comparison of the FAA-defined DNL (“Day/Night Average Sound Level”) values for each site (Figure 6), with and without aircraft noise present.
- Comparison of the median burst frequencies of overflights and ranges of variation at the sites (Figure 7). (“Burst frequency” uses the average time interval between successive members of groups of five peaks to measure instances of highly repetitious overflight events.)
- Comparison of the medians and ranges of variation for noise peak durations recorded at the sites (Figure 8).
Analysis Summaries and Discussion
Note About the Graphical Data: In the following overview plots, the data are plotted indexed by study site. The order of the study sites along the abscissa, left to right, starts with Palo Alto area sites ordered by increasing total daily sound energy (see figure 4), and followed by Santa Cruz sites ordered by distance along the SERFR route, starting with the most distant site (Capitola/Soquel) and progressing toward the EDDYY waypoint (Los Gatos).
1. Number of Overflights per Day
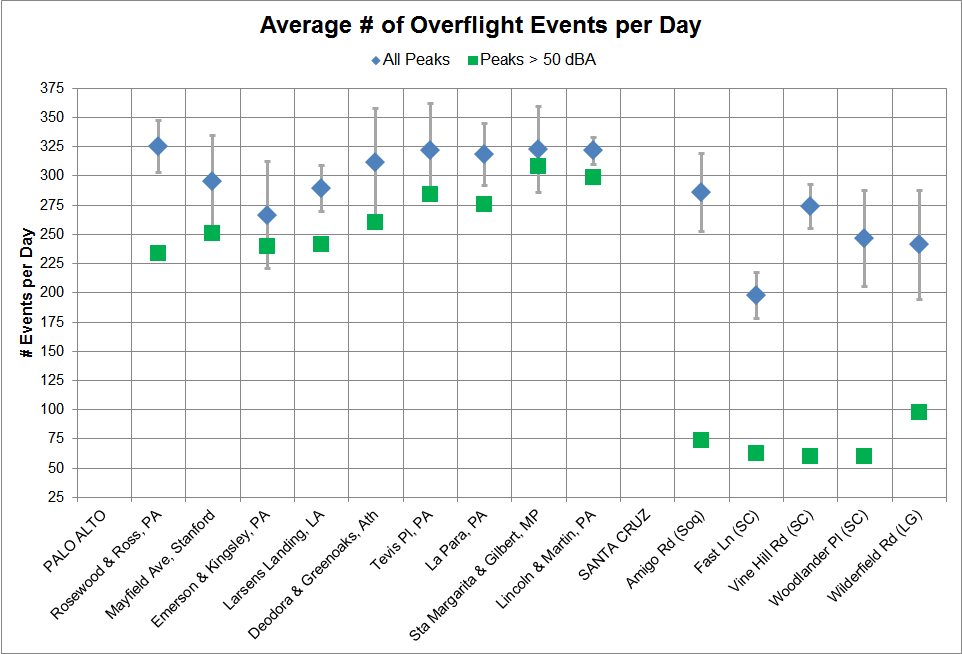
Figure 2 compares the average daily number of noise peaks recorded by site, showing counts for all peaks and for peaks > 50 dBA in amplitude.
The error bars show one standard deviation (1σ) in the distribution of peaks counts for each site. There is some variation in the total numbers of peaks detected between the sites, but typically around 300 per day are heard over PA sites and around 250 peaks per day are heard over SC sites. Discounting nighttime hours (4 hours between 1:00 AM and 5:00 AM), over the remaining 20 hours this means there are on average about 15 overflights per hour in PA and 12-13 overflights per hour in SC.
Another feature seen in the figure is that there are significantly fewer overflight peaks with amplitudes above 50 dBA over SC. Over PA one finds around 275 peaks above 50 dBA, or about 14 per hour, and over SC an average count per day of just over 70, or about 3-4 per hour. These overflights are not uniformly distributed in time and so there are intervals with bursts of overflights at significantly higher frequencies (see Figure 7).
2. Peak Amplitudes and Variations
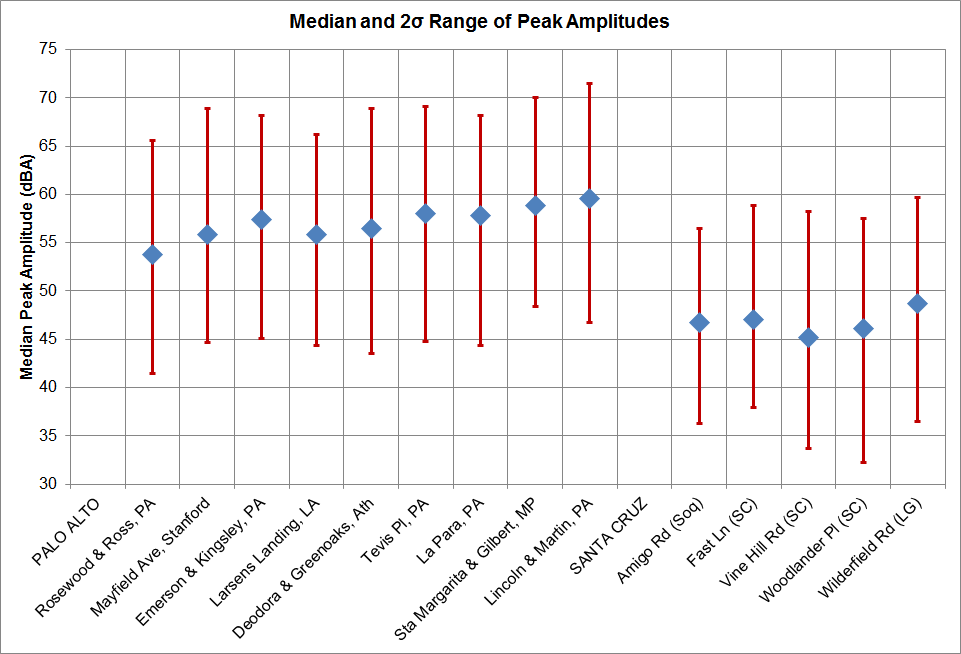
Figure 3 compares the medians and ranges of variation for noise peak amplitudes (sound level maxima) above background recorded at the sites. Generally the medians at the PA sites range between 55 and 60 dBA, while at the SC sites they range between 45 and 50 dBA — a difference of 10 dBA. The distributions of peak amplitudes at each site are not symmetrical so standard deviation measures are computed separately for the amplitudes below and above the median.
The variation bars shown in the figure are 2σ relative to the median in order to give a fair estimate of the highest and lowest values — two standard deviations include about 95% of the peak amplitudes seen. As is evident, at most of the PA sites the highest peak amplitudes range to just below 70 dBA and in SC the range to just under 60 dBA.
3. Peak Sound Energies and Variations
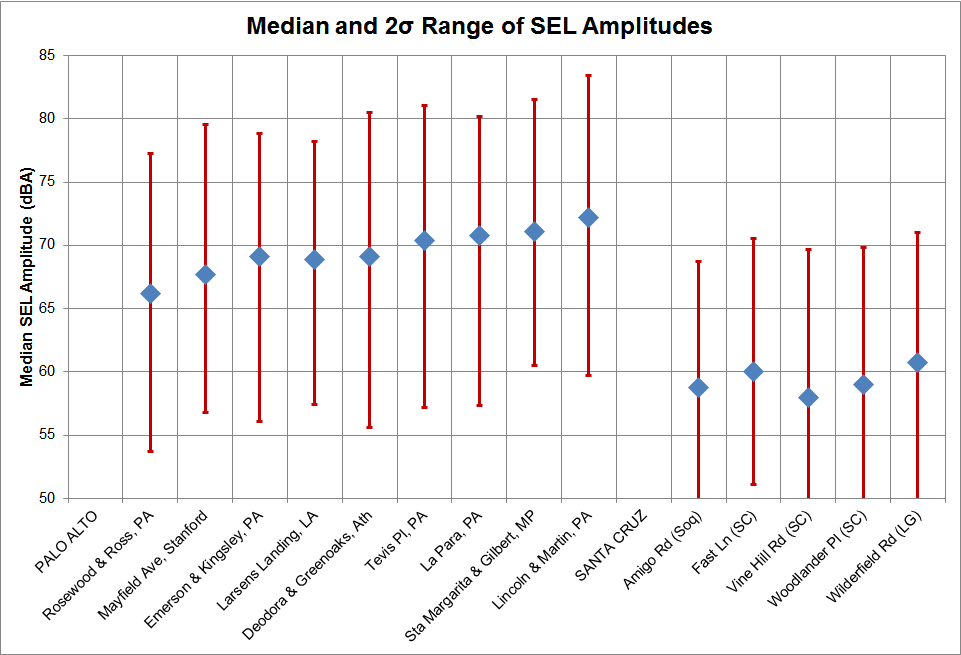
Figure 4 compares the medians and ranges of variation for noise peak energy values (SELs) recorded at the sites. These data are derived from the peak amplitude data by integrating (or summing) the total energy exposure above the background across a noise peak. The medians generally cluster around 70 dBA at the PA sites and 60 dBA at the SC sites. These data also are consistent with the peak amplitude data in Figure 3 and the peak width data in Figure 7 (below). The distributions of peak SELs at each site are not symmetrical so again standard deviation measures are computed separately for the amplitudes below and above the median.
The variation bars shown are 2σ relative to the median in order to give a fair estimate of the high and low values — two standard deviations include about 95% of the SEL amplitudes seen.
4. Total Sound Energy Exposure per Day
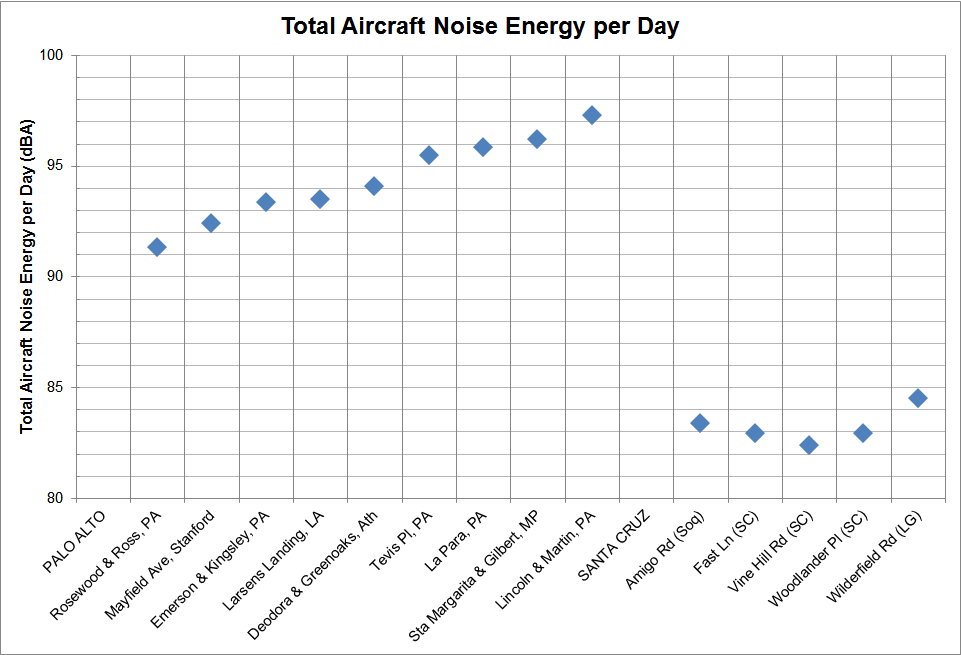
Figure 5 compares estimates of the total sound energy per day recorded at the sites. These data are derived from the SEL amplitude data (Figure 4) and the overflight count data (Figure 2) by multiplying the median SEL amplitude by the median overflight count per day for each site. The total energy estimates range between about 91 and 97 dBA in PA and between 82.5 and 84.5 dBA in SC.
5. FAA-defined DNL Values for Each Site, With and Without Aircraft Noise Present
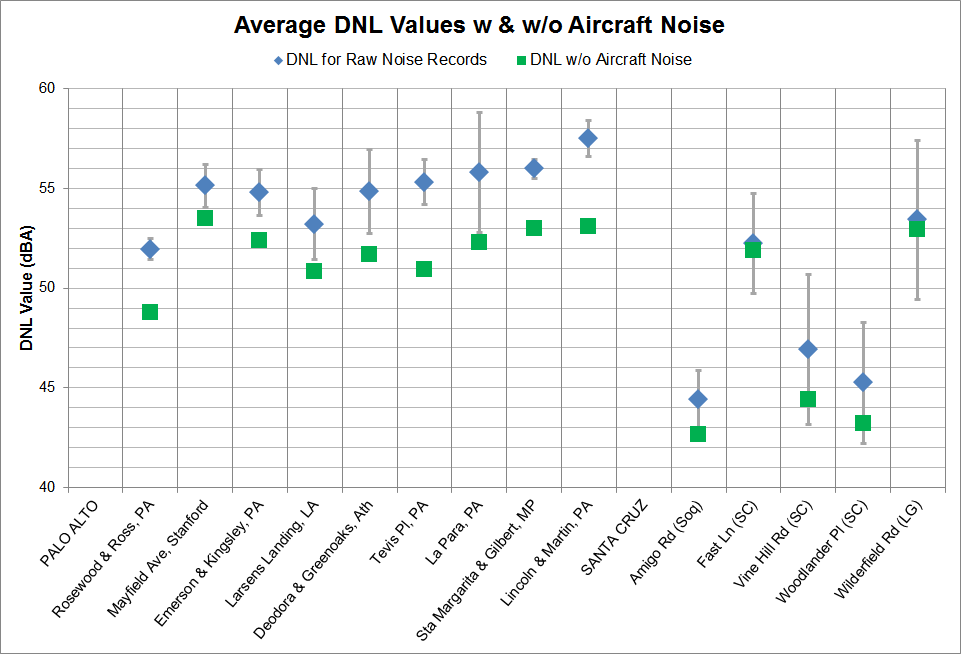
Figure 6 compares the conventional FAA DNL (Day/Night Average Sound Level) sound level measures recorded at the sites, with and without aircraft noise present. The raw noise record data show the average and standard deviation of the individual DNL values computed from each day’s measurements at each site.
Interestingly, the general topology of this graph does not correspond very well with that of the peak amplitude graph (Figure 3), the peak count graph (Figure 2), or the total sound energy exposure plot (Figure 5), especially at the SC sites. It makes one wonder why anyone believes that the DNL measure can/should be used as a reliable surrogate for measuring aircraft noise annoyance.
6. Overflight Burst Frequencies and Variations
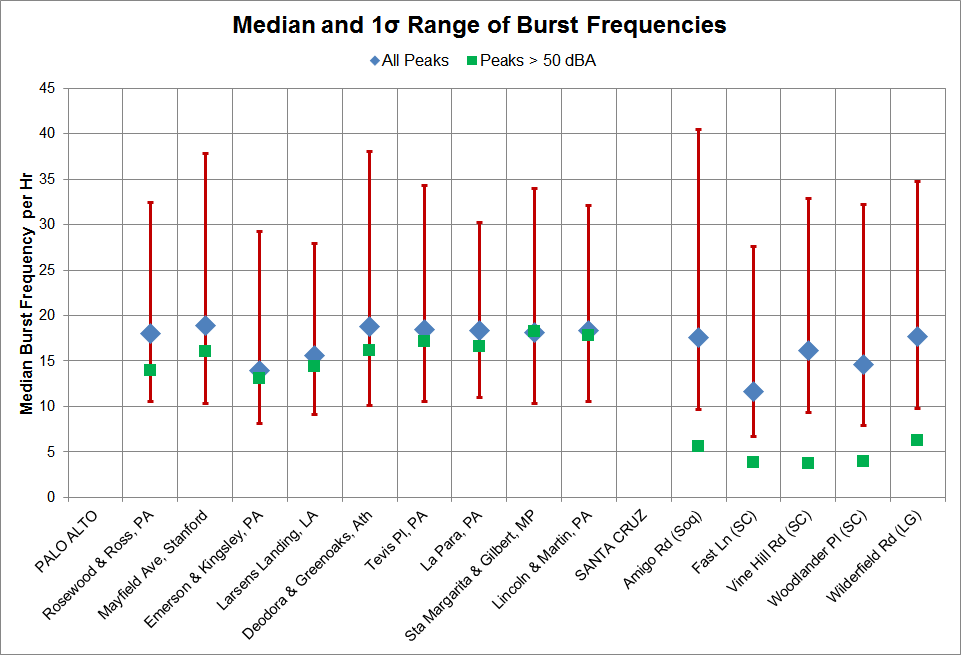
Figure 7 compares the median burst frequencies of overflights and ranges of variation at the sites. “Burst frequency” is defined as the reciprocal of the average time interval between members of successive groups of five noise peaks and is intended to measure instances of highly repetitious overflight events.
The median overflight burst frequencies for ALL peaks (independent of size) cluster around 18 per hour in PA — i.e., about 1 overflight every 3 minutes during the cluster — and 15 per hour in SC — i.e., about 1 overflight every 4 minutes during the cluster. The variation, however, is significantly larger in busy times. The burst frequencies of loud noise peaks (amplitudes > 50 dBA) are close to those of ALL peaks in PA, perhaps 16 per hour, but are considerably less (4-6 per hour) in SC. In SC this means that during busy times loud overflights generally follow each other with intervals of around 12 minutes, whereas in PA they follow about every 4 minutes.
7. Overflight Noise Peak Durations and Variations
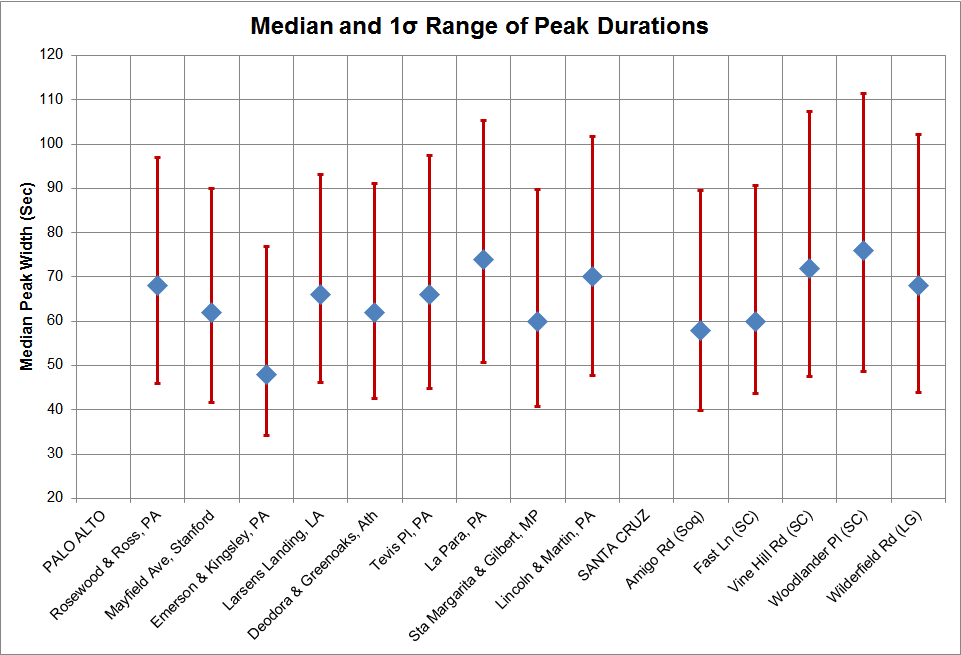
Figure 8 compares the medians and ranges of variation for noise peak durations recorded at the sites.
The median durations are pretty consistently around 60-70 seconds for both PA and SC, but with many excursions between 45 and 100 seconds or more (1σ). As noted above, this would increase the impact of very repetitious overflights with time separations of only one to a few minutes as this renders the sequence of aircraft disturbances as almost continuous. This is less a problem in SC than in PA because of the relative arrival rates of larger noise peaks.
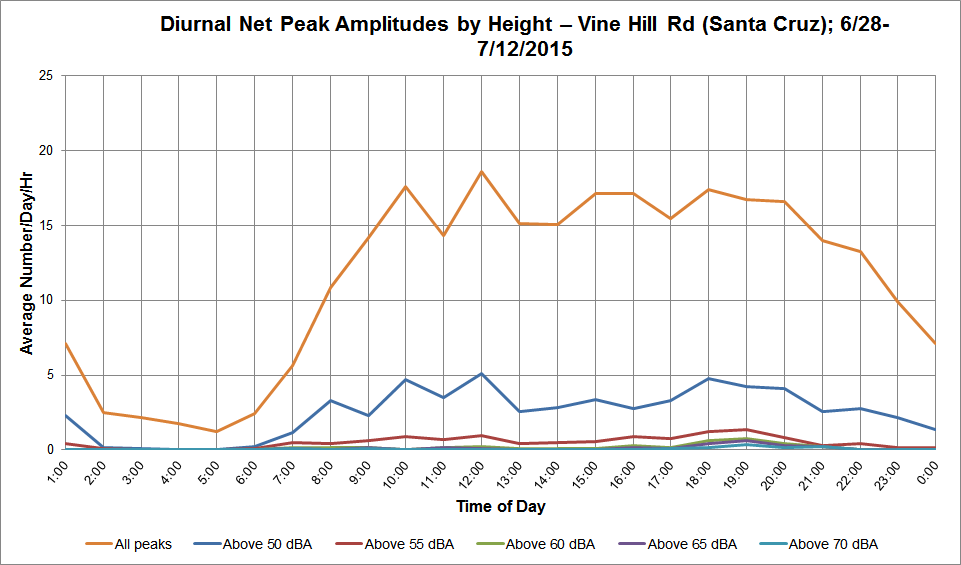
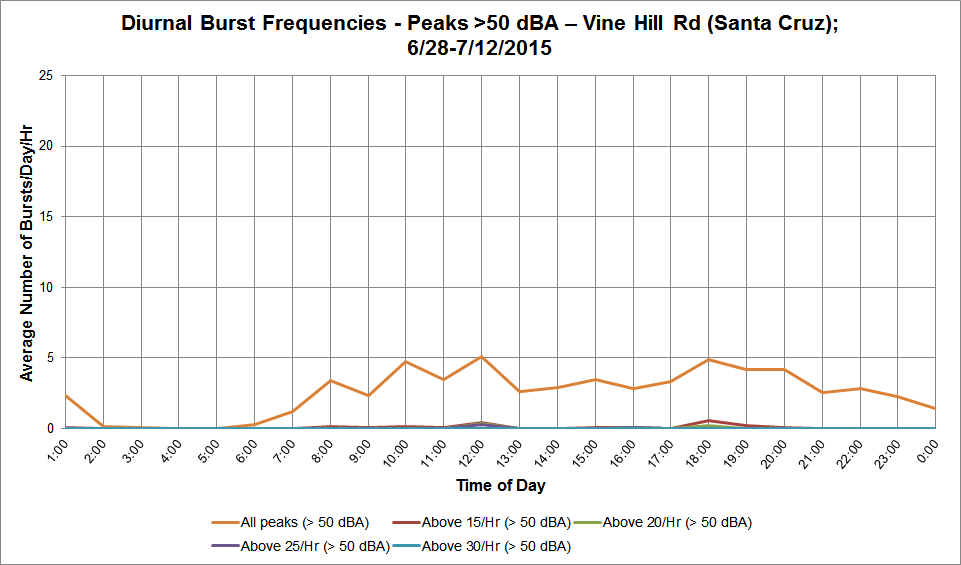
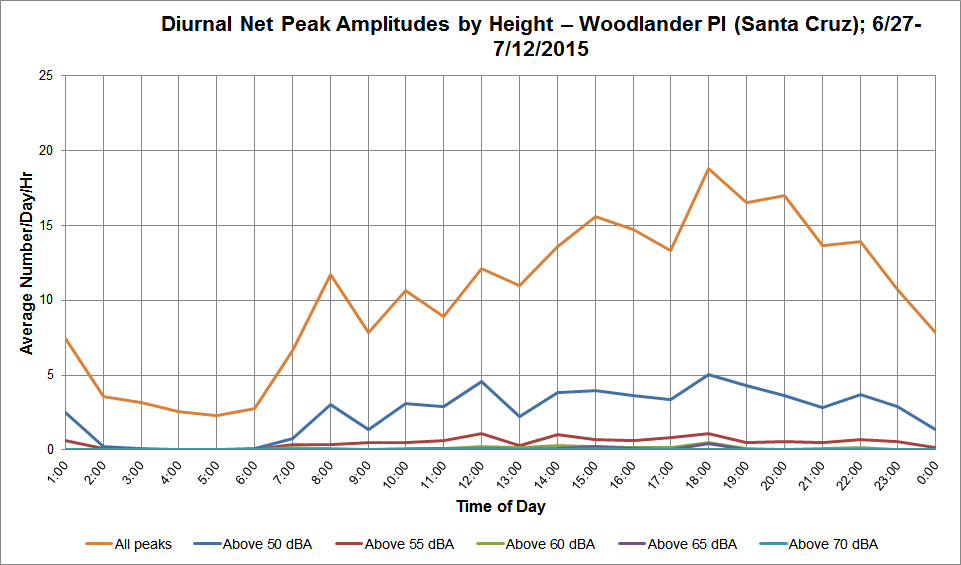
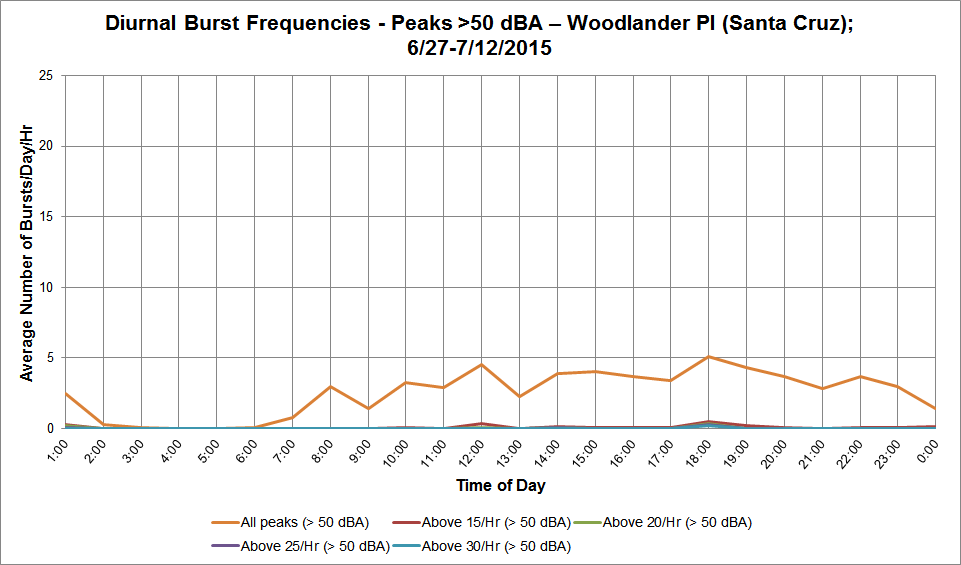
8. Diurnal Distributions of Noise Events by Loudness and Burst Frequencies
Figures 9-1 to 9-28 show for each site the variations in the average number of noise peak events by time of day as measured by net peak amplitudes and by burst frequencies (for peaks with amplitudes > 50 dBA). These plots draw attention to the considerable differences in noise impact by time of day and by geography that depend on flight schedules and approach management criteria used by the FAA. Most of the peak traffic times fall within the prime parts of the day and evening so that they affect school, work, conversations, entertainment, and other daily routines.
Sites in Palo Alto and Surrounding Areas
-
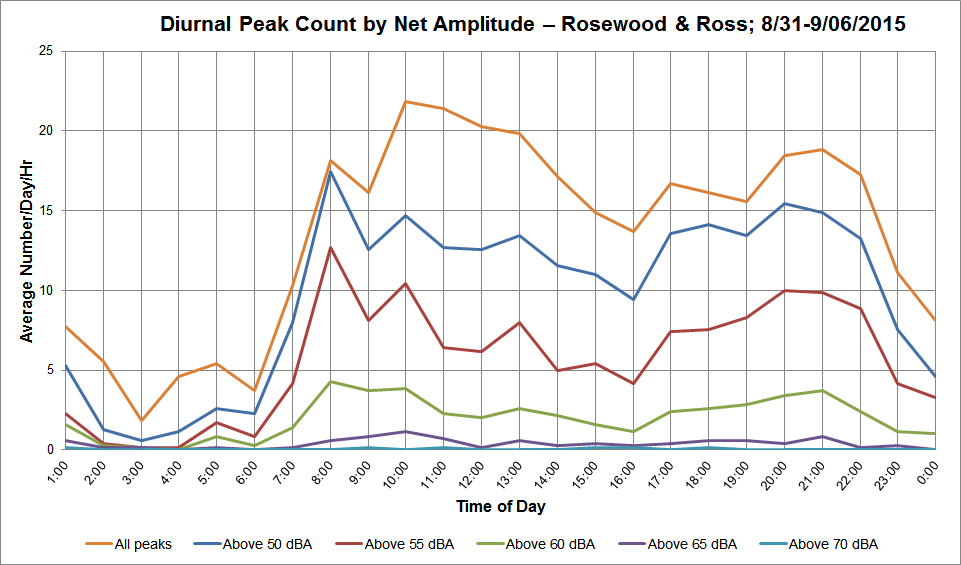
Rosewood & Ross (Palo Alto); 8/31-9/06/2015

Figure 9-1: Diurnal overflight events by peak amplitude (Rosewood & Ross, PA; 8/31-9/06/2015). 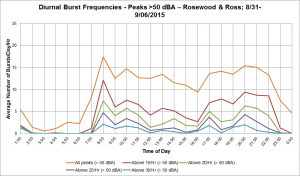
Figure 9-2: Diurnal loud (> 50 dBA) overflights by burst frequencies (Rosewood & Ross, PA; 8/31-9/06/2015). -
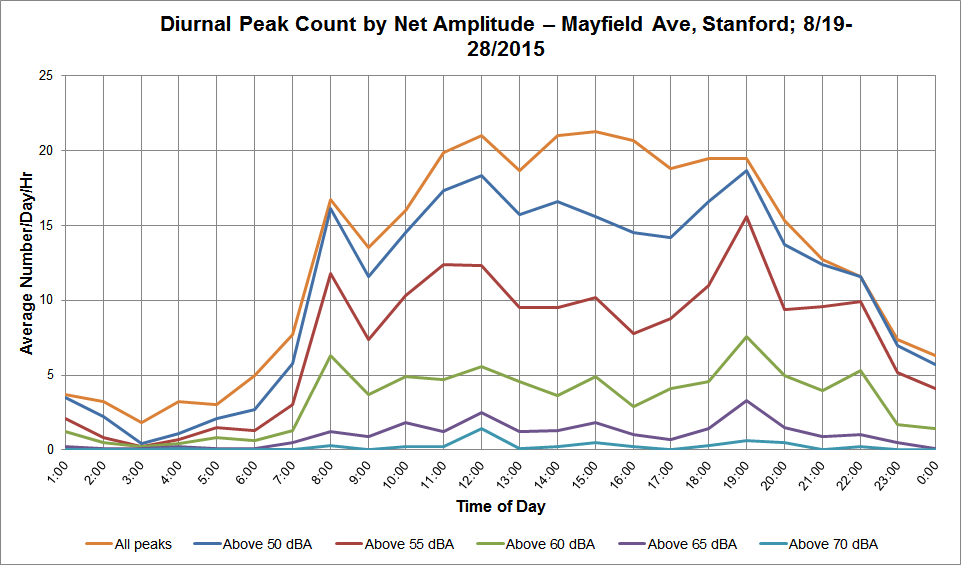
Mayfield Ave (Stanford); 8/19-28/2015
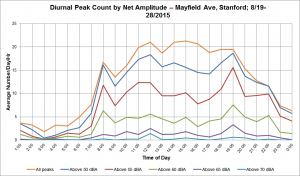
Figure 9-3: Diurnal overflight events by peak amplitude (Mayfield Ave, Stanford; 8/19-28/2015).

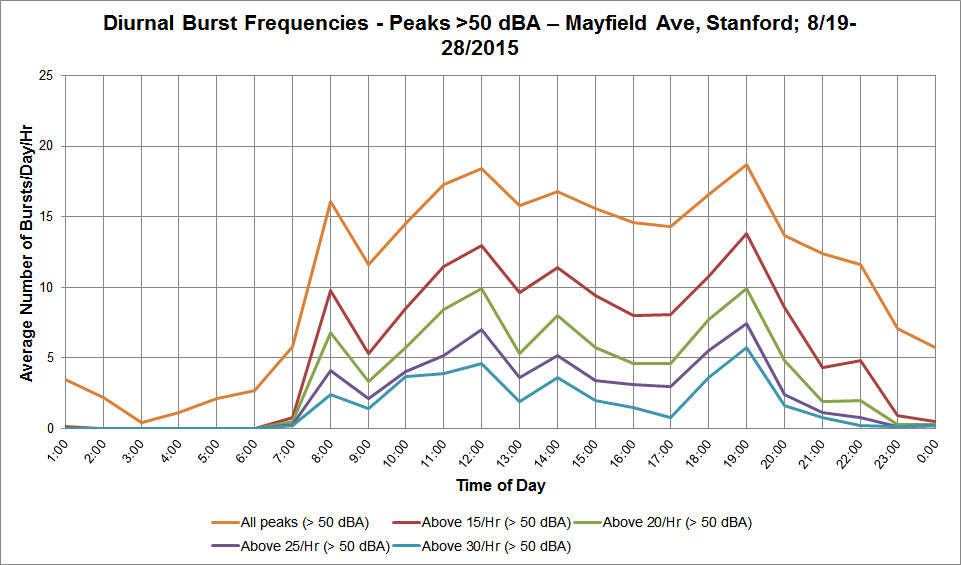
Figure 9-4: Diurnal loud (> 50 dBA) overflights by burst frequencies (Mayfield Ave, Stanford; 8/19-28/2015). -
Emerson & Kingsley (Palo Alto); 9/8-13/2015
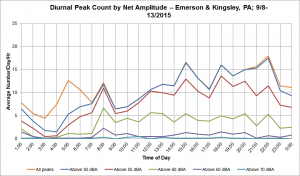
Figure 9-5: Diurnal overflight events by peak amplitude (Emerson & Kingsley, PA; 9/8-13/2015).
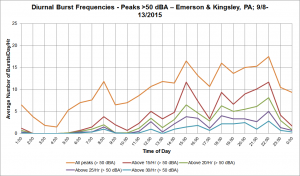
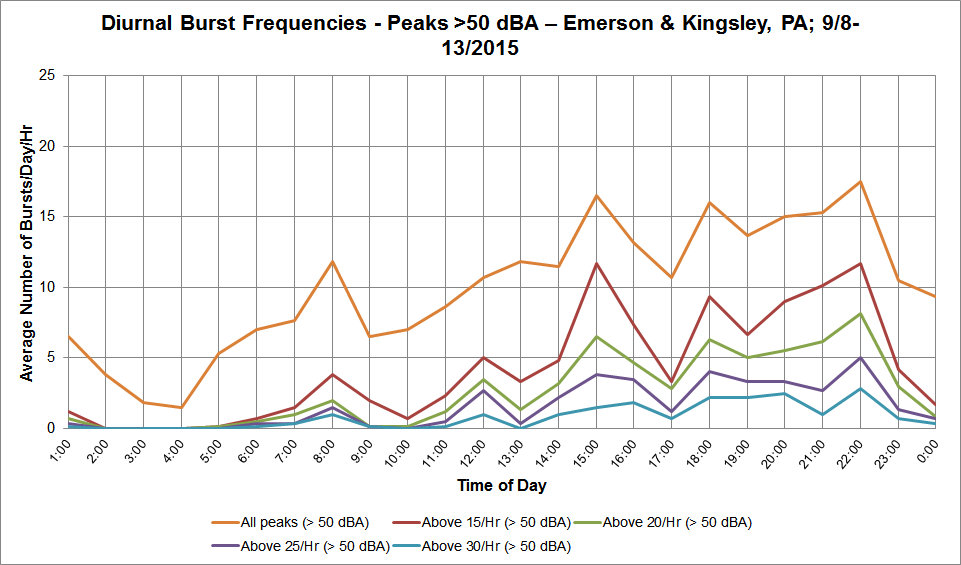
Figure 9-6: Diurnal loud (> 50 dBA) overflights by burst frequencies (Emerson & Kingsley, PA; 9/8-13/2015). -
Larsens Landing (Los Altos); 10/21-27/2015
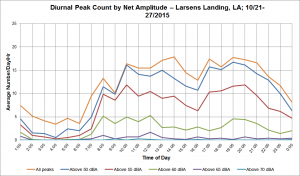
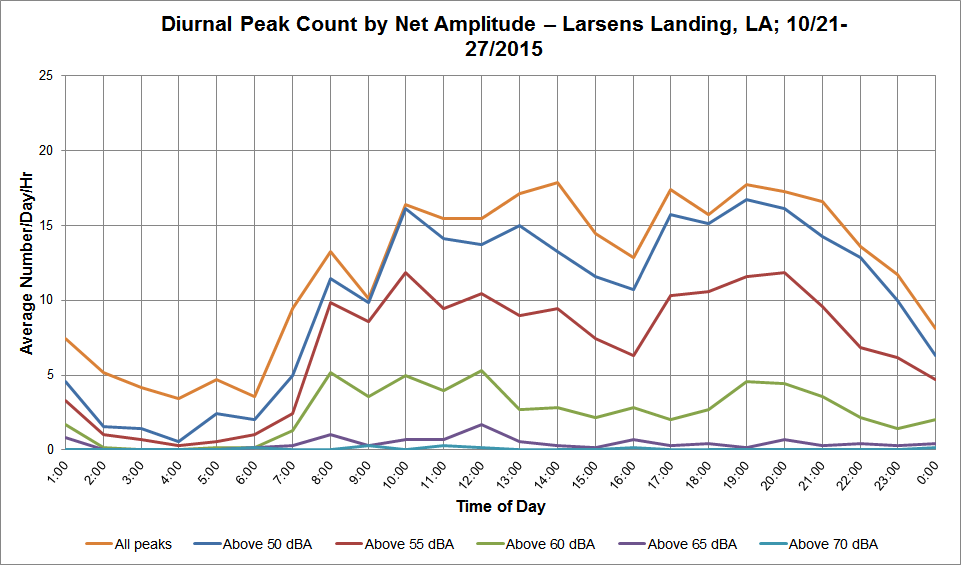
Figure 9-7: Diurnal overflight events by peak amplitude (Larsens Landing, LA; 10/21-27/2015).
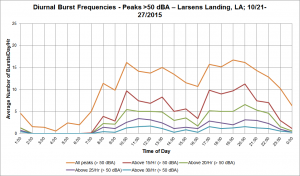
Figure 9-8: Diurnal loud (> 50 dBA) overflights by burst frequencies (Larsens Landing, LA; 10/21-27/2015). -
Deodora & Greenoaks (Atherton); 9/25-29/2015
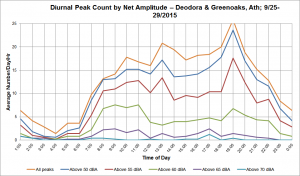
Figure 9-9: Diurnal overflight events by peak amplitude (Deodora & Greenoaks, Ath; 9/25-29/2015).
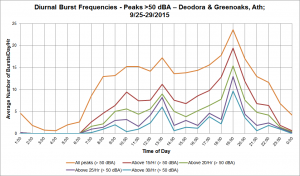
Figure 9-10: Diurnal loud (> 50 dBA) overflights by burst frequencies (Deodora & Greenoaks, Ath; 9/25-29/2015). -
Tevis Pl (Palo Alto); Average Over 6 Observations
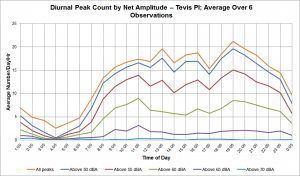
Figure 9-11: Diurnal overflight events by peak amplitude (Tevis Pl, PA; Average Over 6 Observations).

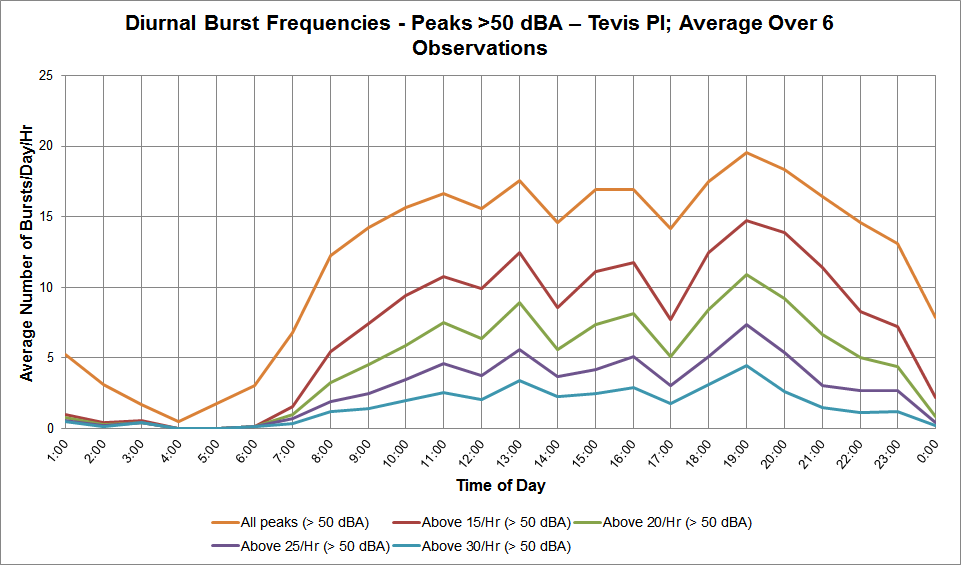
Figure 9-12: Diurnal loud (> 50 dBA) overflights by burst frequencies (Tevis Pl, PA; Average Over 6 Observations). -
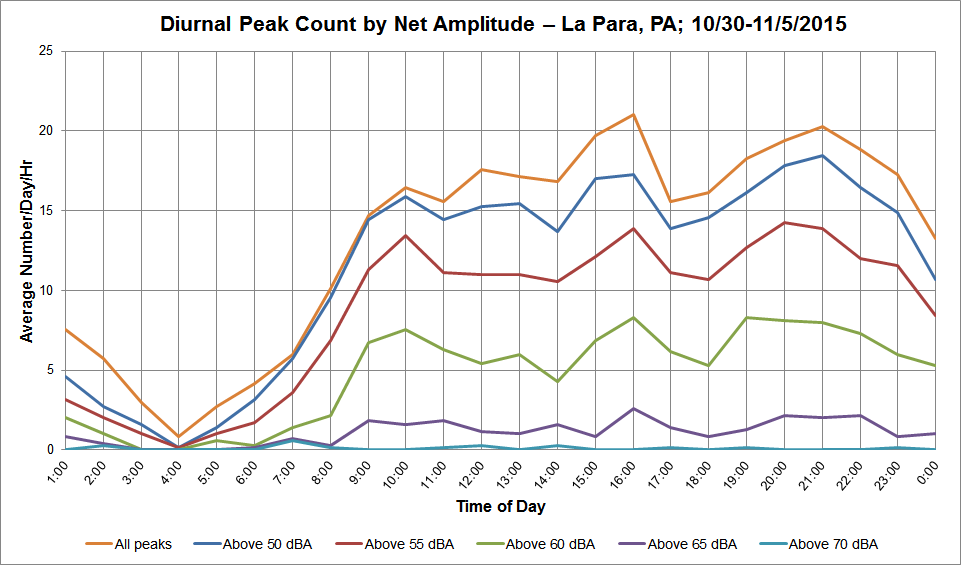
La Para (Palo Alto); 10/30-11/5/2015
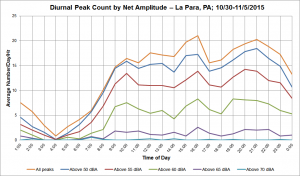
Figure 9-13: Diurnal overflight events by peak amplitude (La Para, PA; 10/30-11/5/2015).
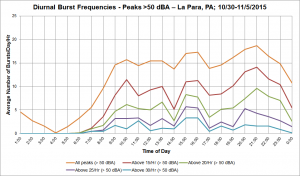
Figure 9-14: Diurnal loud (> 50 dBA) overflights by burst frequencies (La Para, PA; 10/30-11/5/2015). -
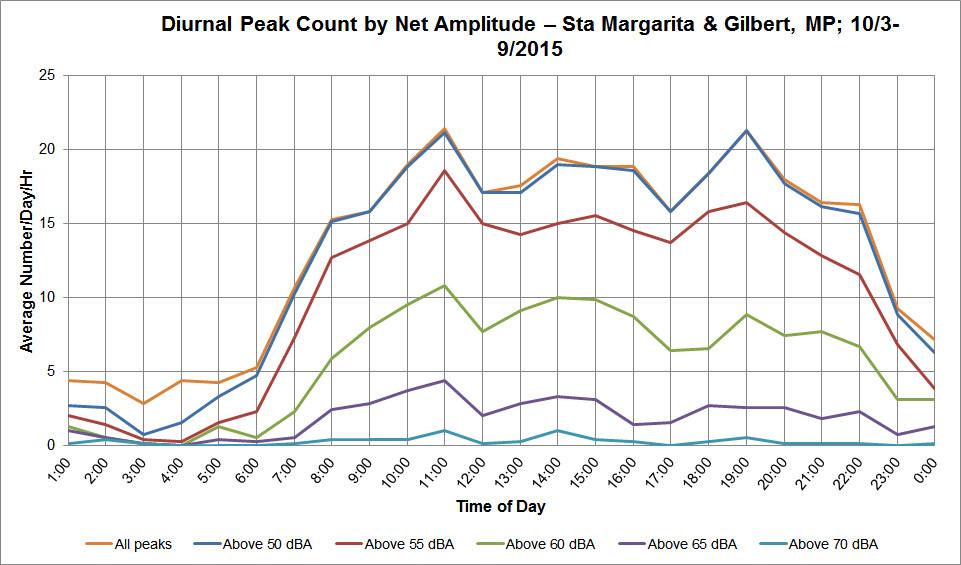
Sta Margarita & Gilbert (Menlo Park); 10/3-9/2015

Figure 9-15: Diurnal overflight events by peak amplitude (Sta Margarita & Gilbert, MP; 10/3-9/2015).
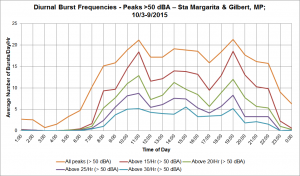
Figure 9-16: Diurnal loud (> 50 dBA) overflights by burst frequencies (Sta Margarita & Gilbert, MP; 10/3-9/2015). -
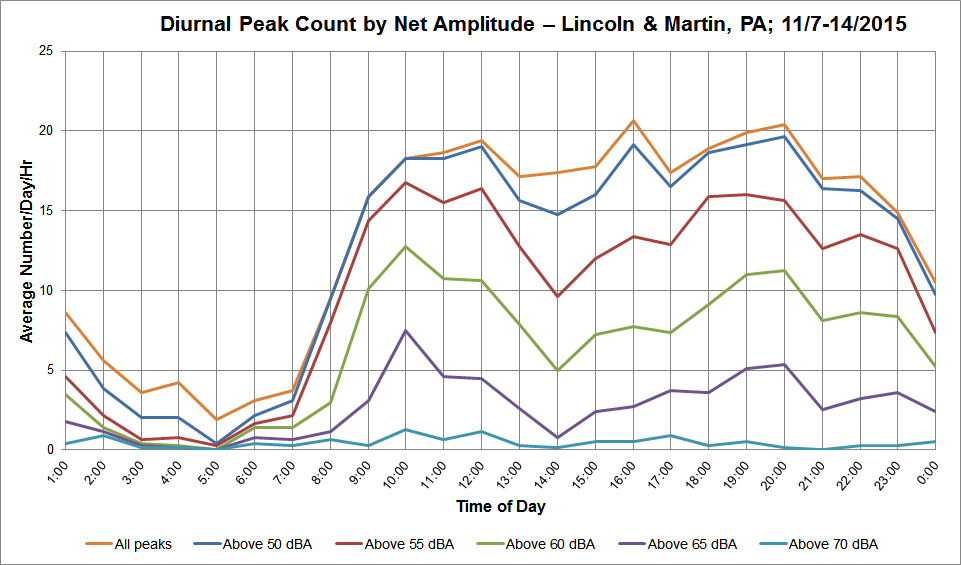
Lincoln & Martin (Palo Alto); 11/7-14/2015

Figure 9-17: Diurnal overflight events by peak amplitude (Lincoln & Martin, PA; 11/7-14/2015).
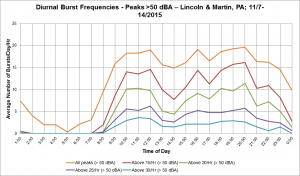
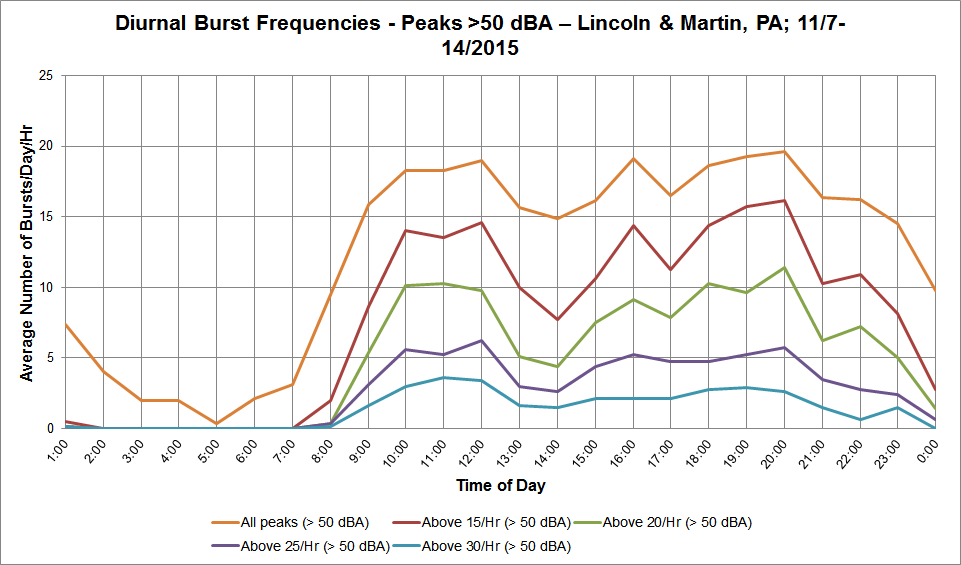
Figure 9-18: Diurnal loud (> 50 dBA) overflights by burst frequencies (Lincoln & Martin, PA; 11/7-14/2015).


Sites in Santa Cruz to Los Gatos
-
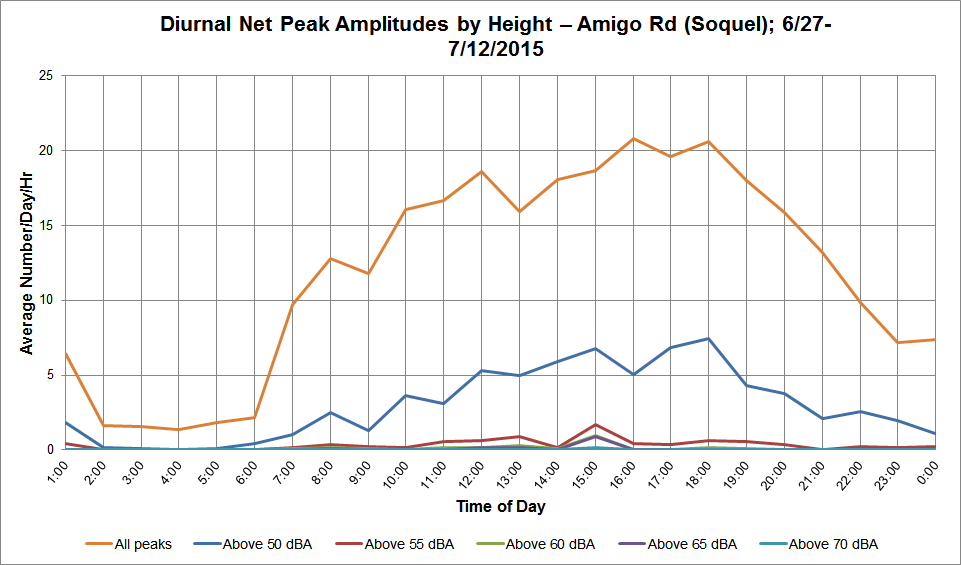
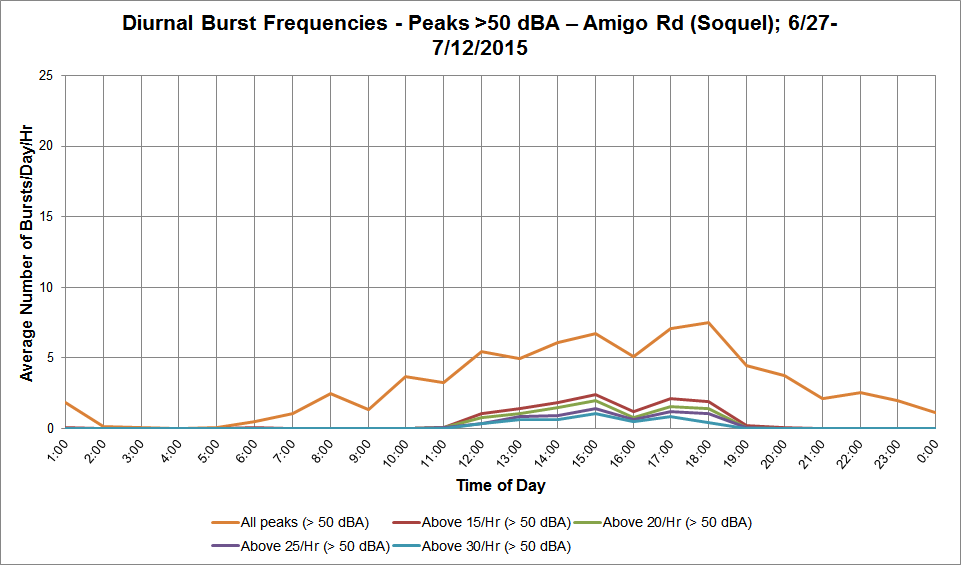
Amigo Rd (Soquel); 6/27-7/12/2015
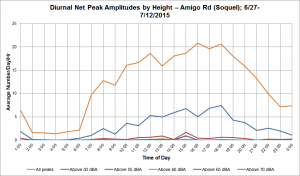
Figure 9-19: Diurnal overflight events by peak amplitude (Amigo Rd, Soquel; 6/27-7/12/2015).

Figure 9-20: Diurnal loud (> 50 dBA) overflights by burst frequencies (Amigo Rd, Soquel; 6/27-7/12/2015). -
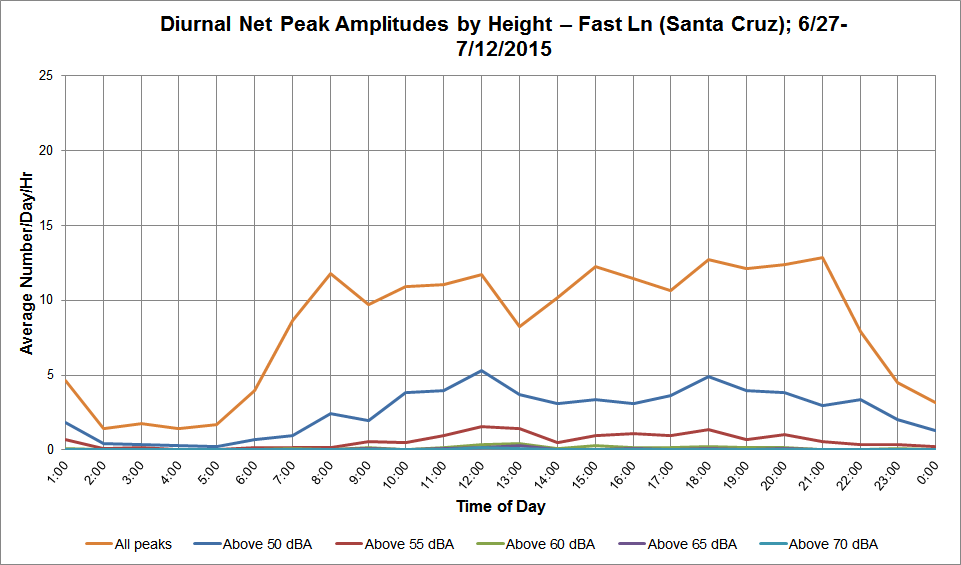
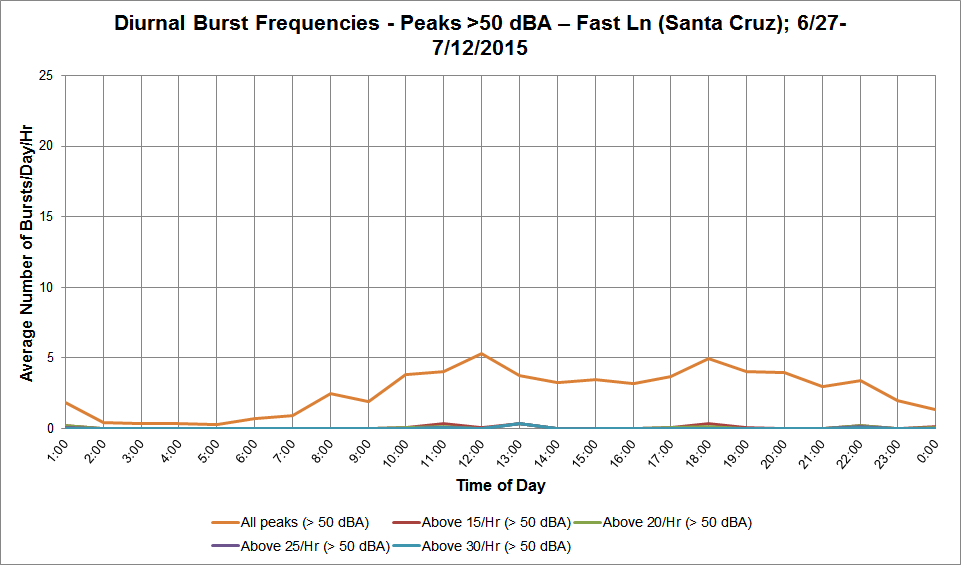
Fast Ln (Santa Cruz); 6/27-7/12/2015
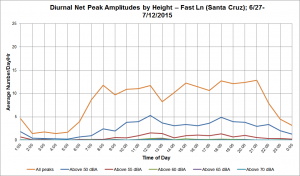
Figure 9-21: Diurnal overflight events by peak amplitude (Fast Ln, Santa Cruz; 6/27-7/12/2015).

Figure 9-22: Diurnal loud (> 50 dBA) overflights by burst frequencies (Fast Ln, Santa Cruz; 6/27-7/12/2015). -
Vine Hill Rd (Santa Cruz); 6/28-7/12/2015

Figure 9-23: Diurnal overflight events by peak amplitude (Vine Hill Rd, Santa Cruz; 6/28-7/12/2015).

Figure 9-24: Diurnal loud (> 50 dBA) overflights by burst frequencies (Vine Hill Rd, Santa Cruz; 6/28-7/12/2015). -
Woodlander Pl (Santa Cruz); 6/27-7/12/2015
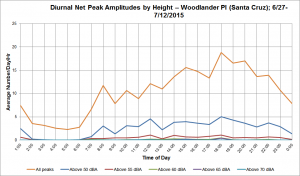
Figure 9-25: Diurnal overflight events by peak amplitude (Woodlander Pl, Santa Cruz; 6/27-7/12/2015).
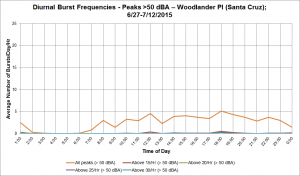
Figure 9-26: Diurnal loud (> 50 dBA) overflights by burst frequencies (Woodlander Pl, Santa Cruz; 6/27-7/12/2015). -
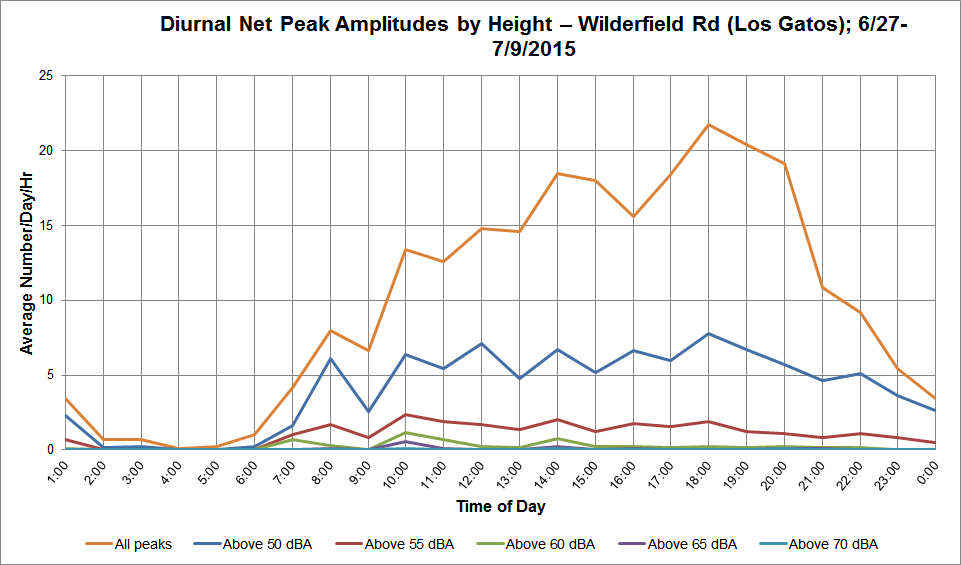
Wilderfield Rd (Los Gatos); 6/27-7/9/2015
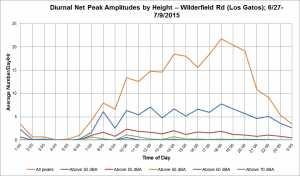
Figure 9-27: Diurnal overflight events by peak amplitude (Wilderfield Rd, Los Gatos; 6/27-7/9/2015).
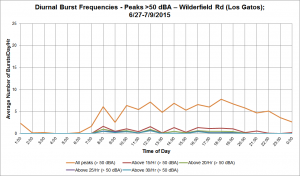
Figure 9-28: Diurnal loud (> 50 dBA) overflights by burst frequencies (Wilderfield Rd, Los Gatos; 6/27-7/9/2015).